Transcription of A Reform Approach to Business Calculus
1 A Reform Approach to Business CalculusMarcel B. FinanArkansas Tech Universityc All Rights Reserved1 PREFACEThis supplement consists of my lectures of a freshmen-level mathematics classoffered at Arkansas Tech University. The lectures are designed to accompanythe textbook Applied Calculus written by Hughes-Hallett et lectures cover Chapters 1, 2, 3, 4, 5, 6, and 7. These chapters are basi-cally well suited for a one semester course in Business B. FinanJanuary 20032 Contents1 functions and Function Notation42 linear Functions93 The Rate of Change154 Applications of functions to Economics215 Exponential Functions266 Logarithms and their Properties337 Exponential Growth and Decay378 Building New functions from Old Ones429 Power and Polynomial Functions4810 Periodic Functions5211 Instantaneous Rate of Change5512 The Derivative Function6013 Leibniz Notation for The Derivative6314 The Second Derivative6515 Marginal Cost and Revenue6816 Derivative Formulas for Power and Polynomials7417 Derivative Formulas for Exponential and Logarithmic Func-tions7718 Derivatives of Composite functions .
2 The Chain Rule8019 The Product and Quotient Rules83320 Derivatives of Periodic Functions8521 Local Maxima and Minima8622 Concavity and Points of Inflection9123 Global Maxima and Minima9424 Applications of Optimization to Marginality9725 Average Cost10126 Elasticity of Demand10527 Logistic Functions10728 Measuring The Distance Traveled11129 The Definite Integral11530 The Definite Integral as Area12031 Interpretations of the Definite Integral12532 The Fundamental Theorem of Calculus12733 The Average Value13034 Consumer and Producer Surplus13235 Present and Future Value of a Continuous Income Stream 13636 Constructing Antiderivatives Analytically13837 Integration by Substitution14238 Using the Fundamental Theorem to Find Definite Integrals14439 Finding Antiderivatives Graphically and Numerically14641 functions and Function NotationFunctions play a crucial role in mathematics.
3 A function describes how onequantity depends on others. More precisely, when we say that a quantityyis afunctionof a quantityxwe mean a rule that assigns to every possiblevalue ofxexactly one value callxtheinputandytheoutput. Infunction notationwe writey=f(x)Sinceydepends onxit makes sense to callxtheindependent variableandythedependent applications of mathematics, functions are often representations of realworld phenomena. Thus, the functions in this case are referred to asmath-ematical the set of input values is a finite set then the modelsare known asdiscretemodels. Otherwise, the models are known ascon-tinuousmodels. For example, ifHrepresents the temperature afterthoursfor a specific day, thenHis a discrete model. IfAis the area of a circle ofradiusrthenAis a continuous are four common ways in which functions are presented and used: Bywords, by tables, by graphs, and by sales tax on an item is 6%.
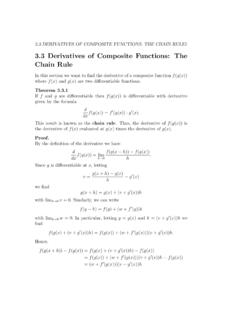
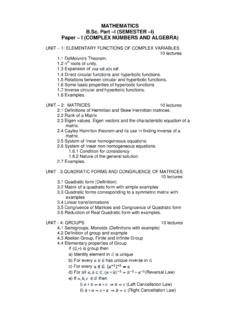
4 So ifpdenotes the price of the item andCthe total cost of buying the item then if the item is sold at $ 1 then the costis 1 + ( )(1) = $ orC(1) = $ the item is sold at $2 then thecost of buying the item is 2 + ( )(2) = $ , orC(2) = $ ,and so we have a relationship between the quantitiesCandpsuch that eachvalue ofpdetermines exactly one value this case, we say thatCisa function this function using words, a table, a graph, and Words:To find the total cost, multiply the price of the item by andadd the result to the price. Table:The chart below gives the total cost of buying an item at pricepasa function ofpfor 1 p Graph:The graph of the functionCis obtained by plotting the data inthe above table. See Figure 1. Formula:The formula that describes the relationship betweenCandpisgiven byC(p) = 1 Example income taxTowed in a certain state is a function of the taxable incomeI,both measured in dollars.
5 The formula isT= 500.(a) Express using functional notation the tax owed on a taxable income of $13,000, and then calculate that value.(b) Explain the meaning ofT(15,000) and calculate its (a) The functional notation is given byT(13,000) and its value isT(13,000) = (13,000) 500 = $930.(b)T(15,000) is the tax owed on a taxable income of $15,000. Its value isT(15,000) = (15,000) 500 = $1, of the Four RepresentationsA formula has the advantage of being both compact and precise. However,not much insight can be gained from a formula as from a table or a graph provides an overall view of a function and thus makes it easy todeduce important properties. Tables often clearly show trends that are noteasily discerned from formulas, and in many cases tables of values are mucheasier to obtain than a evaluate a function given by a graph, locate the point of interest on thehorizontal axis, move vertically to the graph, and then move horizontally tothe vertical axis.
6 The function value is the location on the vertical , most of the functions that we will encounter in this course have for-mulas. For example, the areaAof a circle is a function of its radius r. Infunction notation, we writeA(r) = , there are functions thatcan not be represented by a formula. For example, the value of Dow JonesIndustrial Average at the close of each Business day. In this case the valuedepends on the date, but there is no known formula. functions of this nature,are mostly represented by either a graph or a table of numerical table below shows the daily low temperature for a one-week period inNew York City during July.(a) What was the low temperature on July 19?(b) When was the low temperature 73 F?(c) Is the daily low temperature a function of the date?
7 Explain.(d) Can you expressTas a formula?D17181920212223T73776973757570 Solution.(a) The low temperature on July 19 was 69 F.(b) On July 17 and July 20 the low temperature was 73 F.(c) T is a function ofDsince each value ofDdetermines exactly one valueofT.(d)Tcan not be expressed by an exact far, we have introduced rules between two quantities that define func-tions. Unfortunately, it is possible for two quantities to be related and yetfor neither quantity to be a function of the two quantities related by the equationx2+y2= 4.(a) Isxa function ofy? Explain.(b) Isya function ofx? (a) Fory= 0 we have two values ofx, namely,x= 2 andx= a function ofy.(b) Forx= 0 we have two values ofy, namely,y= 2 andy= a function , suppose that the graph of a relationship between two quantitiesxandyis given.
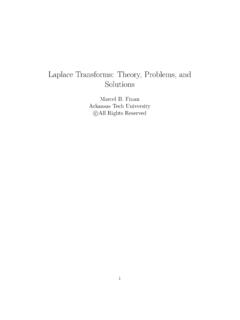
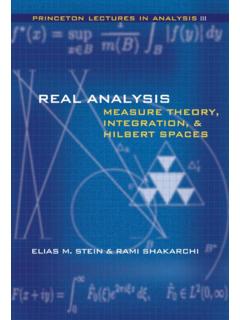
8 To say thatyis a function ofxmeans that for each value ofxthere is exactly one value , this means that each verticalline must intersect the graph at most once. Hence, to determine if a graphrepresents a function one uses the following test:Vertical Line Test:A graph is a function if and only if every verticalline crosses the graph at most to the vertical line test and the definition of a function, if a ver-tical line cuts the graph more than once, the graph could not be the graphof a function since we have multipleyvalues for the samex-value and thisviolates the definition of a of the graphs (a), (b), (c) in Figure 2 representyas a function ofx?8 Figure the vertical line test, (b) represents a function whereas (a) and (c) fail torepresent functions since one can find a vertical line that intersects the graphmore than Problems (pp.)
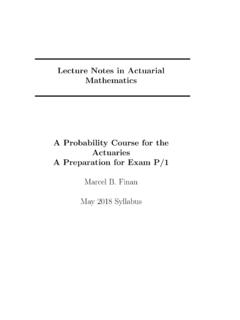
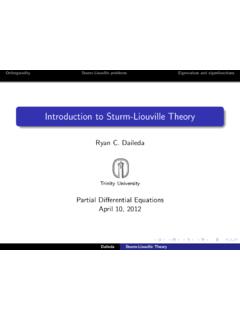
9 4 - 6): 1, 3, 5, 10, 13, 15, 17, 24, linear FunctionsThis section is designed to introduce students to the concept of linear functionfis a function with the property that for any two points(x1, f(x1)) and (x2, f(x2)) on the graph off, thedifference quotientf(x2) f(x1)x2 x1is constant. We say thatyis changing at a constant rate with respect to ,ychanges by the some amount for every unit change , the graph is a straight line ( and thus the term linear ). The constantrate of change, denoted bym,is called theslopeof the line and Figure 3shows its geometrical 3 Example that the functionf(x) =x2is not the points (0,0) and (1,1) we findf(1) f(0)1 0= the other hand, taking the point (1,1) and (2,4) we findf(2) f(1)2 1= ,fis not you pay $ 192 to rent a booth for selling necklaces at an art necklaces sell for $ 32.
10 Explain why the function that shows your netincome (revenue from sales minus rental fees) as a function of the number ofnecklaces sold is a linear (n) denote the net income from sellingnnecklaces. Each time a neck-lace is sold, that is, each timenis increased by 1, the net incomePisincreased by the same constant, $32. Thus the rate of change forPis alwaysthe same, and hencePis a linear Data for LinearityNext, we will consider the question of recognizing a linear function given bya a linear function given by a table. Then the rate of change is thesame for all pairs of points in the table. In particular, when thexvalues areevenly spaced the change inyis of the following tables could represent a linear function?xf(x)01052010301540xg(x) equal increments inxyield equal increments in y thenf(x) is a linearfunction.