Transcription of Acid-Base Titration Curves Using a pH Meter
1 GCC CHM 152LL: Acid-Base Titration Curves GCC 2019 page 1 of 8 Acid-Base Titration Curves Using a pH Meter Introduction: In this experiment you will use a pH sensor to collect volume and pH data as you titrate two acids with sodium hydroxide. You will obtain Titration Curves for the following combinations of acids and bases (exact concentrations will be labeled on the reagent bottles and should be written in your data table): 1) hydrochloric acid , HCl(aq) with sodium hydroxide, NaOH(aq); 2) acetic acid , CH3 COOH(aq) with sodium hydroxide, NaOH(aq). The recorded volume and pH values will generate Titration Curves that will be used to compare features of the strong acid curve versus the weak acid curve. You will determine the equivalence point volume and pH for both Curves .
2 You will estimate the pKa and the Ka for a weak acid from its Titration graph. Refer to Sections , , and of Openstax Chemistry for information on pH calculations, relative strengths of acids and bases, and Acid-Base titrations . Equations to use for the calculations and Explanations: In an Acid-Base neutralization reaction, an acid reacts with a base to produce a salt and water: HA(aq) + MOH(aq) MA(aq) + H2O(l) Equation 1 acid base Salt At the equivalence point for an Acid-Base neutralization reaction, the amount of base added is equal to the amount of acid initially present; thus, the acid has been completely neutralized. When a weak acid solution is initially present, the following ionization reaction will occur: HA(aq) H+(aq) + A-(aq) Equation 2 The equilibrium constant for the ionization of the weak acid , Ka, is: Ka = ]HA[]A][H[ Equation 3 At the volume half-way to the equivalence point during the Titration of a weak acid by a strong base , one-half of the weak acid , HA, has been converted to its conjugate base , A.
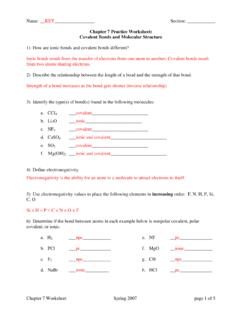
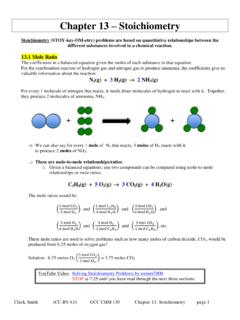
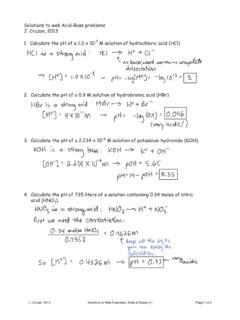
3 Thus, at this half-equivalence point, [HA] = [A-], and Equation 3 simplifies to: Ka = [H+]. By taking the negative log of both sides, this expression becomes: pKa = pH at the the half-equivalence point Equation 4 The equivalence point occurs at the midpoint of the region where the pH rises rapidly. The pKa can be determined by estimating the pH at the volume halfway to the equivalence point. Figure 1b on page 2 shows the location of the equivalence point and half-equivalence point on a weak acid curve. The Ka for a weak acid can then be found from Equation 5: Ka = 10-pKa Equation 5 Finally, the absolute % difference can be calculated for the weak acid ionization constant: Absolute % difference = |experimental Ka theoretical Katheoretical Ka| 100% Equation 6 GCC CHM 152LL: Acid-Base Titration Curves GCC 2019 page 2 of 8 Analyzing Titration Curves : Figure 1a.
4 Distribution of drops to yield a Figure 1b. Acid-Base Titration curve for WEAK Titration with smooth Curves . monoprotic acid . Materials: 2 150 mL beakers 25 mL buret buret clamp Hot/Stir plate 250 mL beaker mL volumetric pipet pipet pump 3-finger clamp pH probe Chromebook GoLink magnetic stir bar KimWipes pH calibration solutions (pH 4 and pH 7) ~ M NaOH (record exact concentrations for all solutions) ~ M HCl ~ M CH3 COOH rulerProcedure: This lab will be performed in two weeks. You will collect data for the HCl-NaOH Titration the first week. You will collect data for the CH3 COOH-NaOH Titration and work on post-lab calculations the second week. **Caution: Sodium hydroxide will attack your skin and is very effective at destroying the tissue of the eyeballs.
5 Make sure you are wearing your goggles at all times and that you rinse off any sodium hydroxide immediately!** 1. Obtain about 15 mL of hydrochloric acid and 50 mL of NaOH in separate beakers. 2. calculate the volume of base needed for your Titration and show your professor the answer. Note: you should assume that mL of acid is present for the Titration since that is the amount you pipet into the Titration beaker. 3. Clean and condition the buret with base refer to the Using a buret to deliver solution technique. You should also review the Performing a Titration technique. After conditioning, fill the buret with NaOH and adjust the level of NaOH so that is initially at (or very close to) mL. 4. Add 50 mL of deionized water into a 250 mL beaker.
6 Pipet mL of HCl into the beaker. 5. Assemble the Chromebook, GoLink, and pH probe system refer to the Using and calibrating a pH probe technique. Calibrate the pH probe Using the pH 4 and pH 7 buffer solutions. Allow some space between your Titration equipment and the computer! GCC CHM 152LL: Acid-Base Titration Curves GCC 2019 page 3 of 8 a. Click the Mode button in the lower left hand corner of Graphical Analysis. Choose Event Based in the Mode drop down menu. b. Select Events with Entry . Change Event Name to Volume . Enter Units as mL . Click Done . Your x-axis should read Volume (mL). c. Click the plot picture above Events with Entry . Select Edit Graph Options . Give the plot an appropriate title.
7 Change appearance to Both to show both the data points and the line for the curve. Click on the autoscaling button for the x-axis and change it to manual scaling. Enter x-axis range: 0 to 16. Click on the autoscaling button for the y-axis and change it to manual scaling. Enter y-axis range: 0 to 14. 6. Clamp the pH probe above the acid solution Using a 3 finger clamp. Lower the pH probe into the acid solution, and adjust its position toward the side of the beaker, so that the sensor does not come into contact with the stirring bar. Begin stirring at a medium rate. Note: Stirring too rapidly could create a vortex around the sensor and possibly affect your pH measurements. 7. Before adding any NaOH, click Collect . Once the pH reading has stabilized, click the Keep button (top middle).
8 A Keep Point window will pop up. Enter the total volume of NaOH added. Click Keep Point . Do NOT click the Stop button until you have collected all data points! You will need to collect 30-40 data points for a good graph. 8. Add approximately 1 mL of base . When the pH stabilizes, click the Keep button. The pH readings may fluctuate; unless you are near the equivalence point, you can click Keep about 20-30 secs after adding base . Click Keep after each addition of NaOH. 9. When your volume of base is within 2 mL of your calculated equivalence point, the pH values will begin increasing more with less volume of base added. Add volume in smaller increments eventually adding dropwise before and after the equivalence point.
9 You want to generate more data points in this region and plot a good curve before and after the equivalence point (see Figure 1a). You also need to wait longer for the pH to stabilize for readings near the equivalence point. 10. After the equivalence point (about 2 mL after your calculated volume), the pH values will change by smaller increments. You can gradually revert back to adding the larger 1 mL increments. Continue adding base in 1 mL increments of base until you ve added a total of 15 mL. 11. When you have finished collecting data, click the Stop button. Make sure there is a line connecting your data points. You may need to click the plot picture in the bottom left corner and select Both under the appearance option.
10 Have your instructor approve your graph before exporting or printing. 12. To print copies of the HCl Titration curve, click the page icon in the upper left corner of the Graphical Analysis window. a. Export Select .CSV . b. Decimal Format Select and click Download CSV c. Select My Drive to save your data Enter a name for your file at the bottom of the screen ( ). Click Save . d. Click the page icon again: e. Export Select Graph Image f. Select My Drive to save your data Enter a name for your file at the bottom of the screen ( ). Click Save . GCC CHM 152LL: Acid-Base Titration Curves GCC 2019 page 4 of 8 g. From the desktop computers on the side tables, open Chrome and login with your MEID and password.