Transcription of ADSL Power Spectrum Density (PSD) Calculation - TI.com
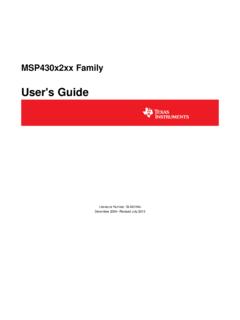
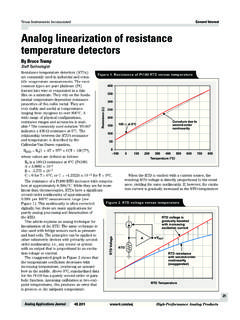
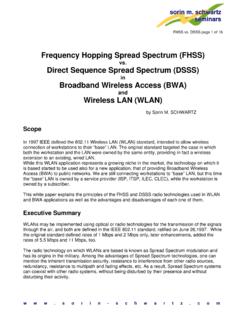
1 Application ReportSPRA955 - September 20031 ADSL Power Spectrum Density CalculationRyan Yi WangABSTRACTThis article describes how to measure ADSL transmission Power Spectrum Density (PSD),and how to calculate signal voltage based on PSD. These calculations can help in designingover voltage protection circuits for ADSL and in debugging ADSL analog PSD Mask in .. 2 DSL Transmission PSD Measurement3.. 3CO PSD Calculation3.. 4 CPE PSD Calculation4.. 5 Conclusion5.. 6 References5.. Appendix A7.. Key Words7.. List of FiguresFigure 1. ATU-C Downstream Transmission Spectral Mask [Ref ]2.. Figure 2. ATU-R Transmission spectral mask [Ref ]2.. 1 Transmission PSD Mask in defines both ATU-C and ATU-R transmission maximum PSD masks as shown in Figure 1and Figure 2. The purpose of the limitation of the PSD mask is to reduce cross-talk noise and tolimit Power 1 shows the ATU-C downstream transmission spectral band for DSL is from 25 kHz to 1 104 kHz.
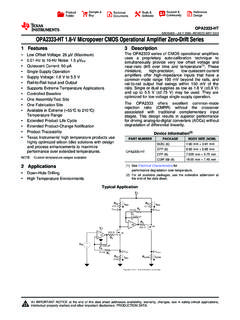
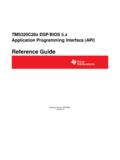
2 The overlapped Spectrum downstream band (forthe non-overlapped Spectrum ) should be from 138 kHz to 1104 PSD mask in this band is are the property of their respective Power Spectrum Density CalculationT1532670 99 PSD indBm/Hz21 dB/octave Peak+15 dBrn0 4 kHz Peak 36 dB/octave 90 dBm/Hz 50 dBm Power in Any1 MHz Sliding WindowAbove 4 545 1043 0934 54511 040 Frequencyin kHz PeakFigure 1. ATU-C Downstream Transmission Spectral Mask [Ref ]Figure 2 shows the ATU-R upstream transmission spectral mask. The band from 25 kHz to 138kHz is for DSL upstream. The limitation in this band is 99 PSD dB/octave dBrn0 4 kHz Peak 48 dB/octave 90 dBm/Hz Peak 50 dBm Power in Any1 MHz Sliding WindowAbove 1 630 kHz411 040 Frequencyin 2211 630 PeakFigure 2. ATU-R Transmission spectral mask [Ref ]SPRA9553 ADSL Power Spectrum Density Calculation2 DSL Transmission PSD MeasurementBoth the central office (CO) and the customer premise equipment (CPE) should guarantee thatits transmission PSD is well below the scope of the PSD mask in The correct way tomeasure transmission of the PSD mask is to terminate a CO transceiver or a CPE transceiverwith a 100 Ohm resistor.
3 Then you would use a high resolution spectral analyzer, and have thedevice under test transmit a wideband signal, such as the REVERB signal or the is not a good idea to terminate with an IDLE status CPE or CO method because not all DSLproducts have a perfect 100 PSD CalculationPower Spectrum Density is described in units of dBm/Hz. Sometimes it is useful to know theapproximate signal voltage based on the PSD. The following section describes how to calculatesignal voltage based on the the maximum downstream PSD mask, also indicates that the average nominalPSD within the downstream pass band shall be no greater than 40 dBm/Hz. The averagenominal PSD level is the PSD level that occurs during training and show time if no poweradjustment is : Power adjustment includes Power cutback and bit and gain table fact, the maximum PSD mask comes from the nominal PSD plus possible pass band ripple,which limits to be no greater than + dB.
4 The final downstream maximum PSD maskbecomes ( 40 + ) dBm/Hz = , as shown in Figure nominal downstream Power in one tone:= nominal PSD * kHz= 40 dBm/Hz + dBm= milliwattIf this single tone is regarded as a pure sine wave, the rough voltage can be calculated:Vrms= sqrt ( Power * Termination Resistor)= sqrt ( milliwatt * 100ohm)= VVpeak-peak on TIP/RING = Vrms * VIf all tones are assumed to be used and they are all at nominal PSD level, a rough nominalaggregate transmission Power can be calculated:SPRA9554 ADSL Power Spectrum Density CalculationThe nominal downstream aggregate transmission Power := nominal PSD * (1104 kHz kHz )= 40 dBm/Hz + 10log1078125= dBm= milliwattThe whole DSL downstream rough average voltage can also be calculated:Vrms= sqrt ( Power * Termination Resistor)= sqrt( milliwatt * 100 ohm)= VThis is not a pure sine wave any more. A DMT signal is like a random white noise signal,because each tone changes its amplitude and phase simultaneously.
5 Sometimes, most of toneswill get to their highest amplitude together and create a very high peak. If this peak is clipped byline driver, it will cause some errors. Experiments and statistics show it is usually a timesVoltage/Voltage Peak Average Rate (PAR) that can keep 10 7 bit error rate (BER). * V = V of peak voltage at Tip/Ring or V of peak to peakNOTE:This computation is based on ADSL over POTS implemented with PSD CalculationSimilar to the CO side, also defines that the average nominal PSD within the upstreampass band shall be no greater than 38 the pass band ripple, which limits to no greater than + dB, the finalupstream maximum PSD mask becomes 38 dBm/Hz + = dBm/Hz as shown inFigure 2. All of the Power -relevant calculations are similar with CO:The nominal upstream Power in one tone:= nominal PSD * kHz= 38 dBm/Hz + dBm= milliwattIf this single tone is regarded as a pure sine wave, the rough voltage can be calculated:Vrms= sqrt ( Power * Termination Resistor)= sqrt ( milliwatt * 100 ohm)= VVpeak-peak on TIP/RING =Vrms * VSPRA9555 ADSL Power Spectrum Density CalculationIf all tones are assumed to be used and they are all at nominal PSD level, the rough nominalaggregate transmission Power can be calculated:The nominal upstream aggregate transmission Power := nominal PSD * (138 kHz kHz )= 38 dBm/Hz + 10log112125= dBm= milliwattsWhole DSL upstream rough average voltage can also be calculated:Vrms= sqrt ( Power * Termination Resistor)= sqrt ( milliwatt * 100 ohm)= VThis is not a pure sine wave any more, and it has a very big Peak Average Ratio (PAR).
6 Let sassume times Voltage/Voltage * V = V of peak voltage at Tip/Ring or V of peak to peak5 ConclusionThe calculations above provide the ability to choose an appropriate over-voltage protectioncircuit for DSL without clipping a normal DSL signal. This information can also assist in capturingan abnormal ADSL signal when bringing up a new DRAFT NEW RECOMMENDATION , July 1999, ITU Study Power Spectrum Density CalculationSPRA9557 ADSL Power Spectrum Density CalculationAppendix Key WordsDMT: discrete multi-tone : ITU ADSL standard , also named : Power Spectrum densityATU-C : ADSL transceiver unit at central office end, also named central office(CO)ATU-R : ADSL transceiver unit at remote terminal end, also named customer premise equipment(CPE)showtime: the state of either ATU-C or ATU-R reached after all initialization and training iscompleted in which user data is : Power cut backB&G: bit and gain tableSPRA9558 ADSL Power Spectrum Density CalculationIMPORTANT NOTICET exas Instruments Incorporated and its subsidiaries (TI) reserve the right to make corrections, modifications,enhancements, improvements, and other changes to its products and services at any time and to discontinueany product or service without notice.
7 Customers should obtain the latest relevant information before placingorders and should verify that such information is current and complete. All products are sold subject to TI s termsand conditions of sale supplied at the time of order warrants performance of its hardware products to the specifications applicable at the time of sale inaccordance with TI s standard warranty. Testing and other quality control techniques are used to the extent TIdeems necessary to support this warranty. Except where mandated by government requirements, testing of allparameters of each product is not necessarily assumes no liability for applications assistance or customer product design. Customers are responsible fortheir products and applications using TI components. To minimize the risks associated with customer productsand applications, customers should provide adequate design and operating does not warrant or represent that any license, either express or implied, is granted under any TI patent right,copyright, mask work right, or other TI intellectual property right relating to any combination, machine, or processin which TI products or services are used.
8 Information published by TI regarding third-party products or servicesdoes not constitute a license from TI to use such products or services or a warranty or endorsement of such information may require a license from a third party under the patents or other intellectual propertyof the third party, or a license from TI under the patents or other intellectual property of of information in TI data books or data sheets is permissible only if reproduction is withoutalteration and is accompanied by all associated warranties, conditions, limitations, and notices. Reproductionof this information with alteration is an unfair and deceptive business practice. TI is not responsible or liable forsuch altered of TI products or services with statements different from or beyond the parameters stated by TI for thatproduct or service voids all express and any implied warranties for the associated TI product or service andis an unfair and deceptive business practice.
9 TI is not responsible or liable for any such are URLs where you can obtain information on other Texas Instruments products and & Address:Texas InstrumentsPost Office Box 655303 Dallas, Texas 75265 Copyright 2003, Texas Instruments Incorporat