Example: stock market
Age Adjustment Using the 2000 Projected U.S. Population
age group is the size of the corresponding age group in the standard population divided by the total standard population for all ages of interest. Table 2 shows 22 different population age distributions used in calculating baseline data from various major data systems for the Healthy People 2010 objectives that use age adjustment.
Tags:
Information
Domain:
Source:
Link to this page:
Documents from same domain

School Chemistry Laboratory Safety Guide
www.cdc.govSchool Chemistry Laboratory Safety Guide. October 2006. U.S. Consumer Safety Product Commission DEPARTMENT OF HEALTH AND HUMAN SERVICES. Centers for Disease Control and Prevention

Biosafety in Microbiological and Biomedical …
www.cdc.goviii. Foreword. Biosafety in Microbiological and Biomedical Laboratories (BMBL) quickly became the cornerstone of biosafety practice and policy in the United States upon first
Sobering Facts: Drunk Driving in Georgia
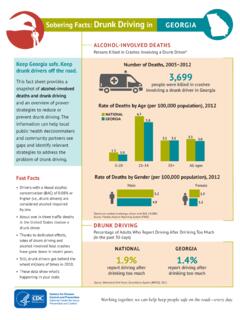
www.cdc.govSobering Facts: Drunk Driving in GEORGIA Keep Georgia safe. Keep drunk drivers off the road. This fact sheet provides a snapshot of alcohol-involved deaths and drunk driving
ALCOHOLS III 1402
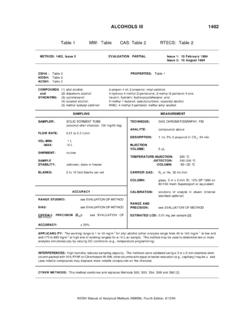
www.cdc.govALCOHOLS III: METHOD 1402, Issue 2, dated 15 August 1994 - Page 3 of 4 a. Remove and discard back sorbent section of a media blank sampler. b. Inject a known amount of analyte or DE stock solution directly onto front sorbent section
Fast Facts
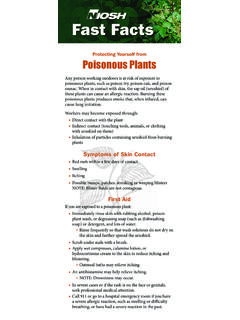
www.cdc.govAny person working outdoors is at risk of exposure to poisonous plants, such as poison ivy, poison oak, and poison sumac. When in contact with skin, the sap oil (urushiol) of
Trans Fat: The Facts
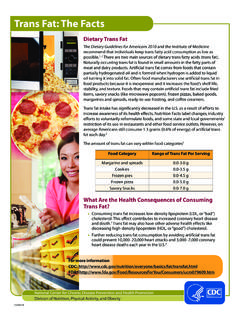
www.cdc.gov• Read the Nutrition Facts label and ingredient list to compare foods. » Choose products with 0 grams trans fat. » Check the Ingredient List to see if there is any partially hydrogenated oil in the product.

ANTIBIOTIC RESISTANCE THREATS
www.cdc.govApr 23, 2013 · 6. ANTIBIOTIC RESISTANCE THREATS IN THE UNITED STATES, 2013. Executive Summary. Antibiotic Resistance Threats in the United States, 2013. is a snapshot of the complex problem

Chlorine Residual Testing
www.cdc.govChlorine Residual Testing Fact Sheet, CDC SWS Project 4 Methods to Test Free Chlorine in the Field in Developing Countries There are three main methods to test free chlorine residual in drinking water in the field
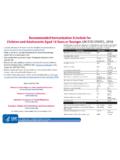
2018 Combined Recommended Immunization …
www.cdc.govRecommended Immunization Schedule for Children and Adolescents Aged 18 Years or Younger, UNITED STATES, 2018 Approved by the Advisory Committee on …
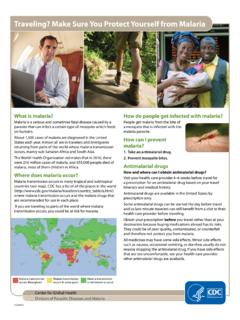
Traveling? Make Sure You Protect Yourself from …
www.cdc.govCS26201 Malaria transmission occurs throughout Malaria transmission occurs in some parts Malaria transmission is not known to occur Center for Global Health
Related documents
POVERTY PROFILE: SPECIAL EDITION
www.canada.caGrowing population: The racialized population is growing at a faster rate than the non-racialized population. By 2031, it is projected that about one Canadian in three could belong to a racialized group, up from one in 20 in 1981.1 Geographically concentrated: More than half (54%) of the racialized population lives in Ontario, followed

2020 Excess Deaths in the U.S. General Population by Age ...
www.soa.orginformation from 2010 to 2019. These numbers are used to create prior year death rates. The projected death rates are multiplied by 2020 population estimates to determine expected 2020 deaths. The 2020 population estimates are based on applying a five-year linear trend to the populations from 2015 to 2019 by sex and age group.
YOUTH IN INDIA
mospi.nic.in8. Share of Youth Population (15-34 Years) Sex wise, in Major Countries of Asia (1970-2020) 18 ii. Marital Statistics 19-21 9. Percentage of Currently Married Females to all Females for Different Age-Group 19 10. Mean Age of Females at Effective Marriage; All India and Major States 20 11.
The Population 65 Years and Older in the United States: 2016
www.census.govpercent) of the total population of 9.4 billion will be 65 and older. This rapid growth of the older popula-tion contrasts with an almost flat youth population (under age 20) and moderate increase in the working-age (aged 20 to 64) population projected over the same period. 1 The older population is also growing across world
KNOWLEDGE OF DIVERSE LEARNERS: IMPLICATIONS FOR …
files.eric.ed.govteachers must be prepared to teach a diverse population of student (Banks et al. 2005). In other words, teachers need to be aware that their students in a classroom are and always have been different from one another in a variety of ways. KDL refers to an understanding of diversity of students in terms of their abilities and

Future of an Ageing Population - GOV.UK
assets.publishing.service.gov.ukThe proportion of the working age population aged between 50 and the state pension age (SPA) will increase from 26% in 2012 to 34% in 2050 – an increase of over 5.5 million people. This is the result of increases to the SPA, as well as the so called ‘baby boomers’ reaching this age band. The productivity