Transcription of Agilent 5800 ICP-OES brochure
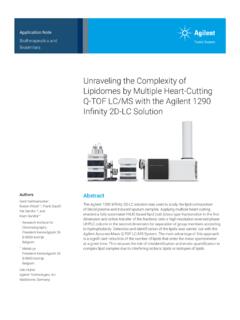
1 Agilent 5800 ICP-OESR eclaim your wasted time230%of service calls are unnecessary15%of samples are remeasuredThe Smart Way to Stop Wasting Time and Get the Right AnswersThere are many reasons why ICP-OES samples need to be remeasured: QC failures, instrument problems, incomplete sample digestion, simple sample mix-ups, and more. There are also many reasons why you might be worried about the accuracy of the results you are lab time wastersThe Agilent 5800 has an ecosystem of embedded sensors powerful processors with smart algorithms and diagnostics designed to automate troubleshooting, preempt maintenance, and identify problems that could impact results.
2 Always working behind the scenes, the 5800 thinks like an expert, and can make recommendations and solve problems before they happen. This smart functionality reduces the number of samples you have to remeasure and gives you more confidence in your maintenance and downtimeUp to 30% of service calls are unnecessary. The instrument operator could have solved the problem if only they knew what was going wrong and how to fix samplesA recent poll* found that, on average, labs are remeasuring 15% of their ICP-OES samples.
3 Interestingly, over 15% of labs don t consider their sample remeasurement rate at all, so have no idea of the time they are wasting or how much it s costing service calls are unnecessary15%of samples are remeasured* Results from an online poll of over 200 laboratories, conducted in 2019 Agilent service data, from November 2017 to October 20183 The Agilent 5800 ICP-OESThe smart features of the 5800 are like having an experienced analyst beside you guiding you to achieve the right answer the first United States Environmental Protection Agency (US EPA).
4 (2001a). OTS Alert #2, Use of the ICP analytical method (CLP SOW , SW-846 6010, MCAWW ) for drinking water samples may result in false positive detections of arsenic, lead, and/or thallium above their respective MCLs. Office of Technical Standards. Washington, Susan D. Chapnick, Leonard C. Pitts, Nancy C. Rothman. Arsenic and Thallium Data in Environmental Samples: Fact or Fiction? REMEDIATION Autumn 2010, Wiley Periodicals, because QCs pass, it doesn t mean the results are correctThe Environmental Protection Agency Office of Technical Standards issued an alert1, stating that an estimated 25 to 50% of arsenic results are false-positive in environmental data reported using ICP-AES.
5 Three subsequent case studies2 demonstrated arsenic bias. This was despite US EPA method quality control results being acceptable. It was demonstrated that batch QC samples do not always accurately assess the effects of the environmental sample matrix on the accuracy and precision of the results for samples contained within the batch. 4It s like having QC on every sampleIf your results are too high, it could be due to a spectral interference from another element. Results that are too low could be due to chemistry problems.
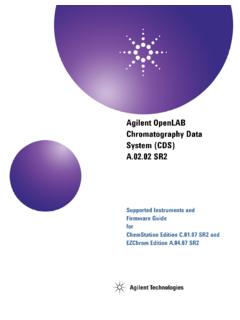
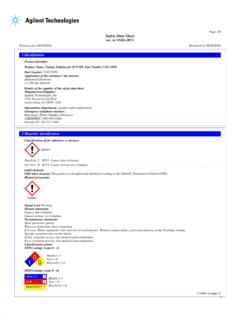
6 IntelliQuant uses data analytics to automatically identify spectral overlaps that can lead to false-positive results, and recommends the emission wavelength that will give the most accurate example on the right shows the measurement of cadmium at nm. The measured emission (blue line) has been erroneously increased by the presence of an emission from arsenic (red line). IntelliQuant will flag this wavelength as being problematic using a star ranking feature (shown below) to make it easy for the user to select the right wavelength to report on.
7 IntelliQuant puts the power of an experienced analyst inside your instrument and only Agilent has itIntelliQuant captures data from the entire wavelength range as each sample is measured, then uses this broader view to calculate the approximate concentration of up to 70 elements in a sample. By collecting more than just the data at the wavelengths nominated, IntelliQuant sees spectral interferences and provides you with recommendations to ensure you get the right answers every time. Running unknown or atypical samples?
8 Put IntelliQuant to work, and ease your method development, troubleshooting, and sample screening insight into what s in your sample and how to best measure itLearn More About Your ** ** * * ** *Analyte: Cd( )Confidence: moderateInterference: As( )Confidence: spectrumIntensity100002000030000400000-4 000interferentWavelength (nm)IntelliQuant Star ranking output for Cd. A five-star ranking with green check mark indicates Cd 214 wavelength to be the best. The red question mark indicates there is an issue on Cd 228, and the pop-up tip indicates the Cd 228 result has only moderate confidence as it has a strong arsenic interference.
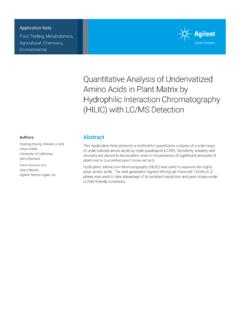
9 5 Flagging outlying resultsAn outlier alert highlights results that exceed a nominated range or don t pass a test. The outlier alert system can monitor a range of parameters, from %RSD through to failed QC tests, and can be configured to your can be filtered to show only the samples that have failed. Filtering makes it easy to see which results need to be image below shows the flagging of outlier results on the sample results screen. On the right is shown a filter applied to display only the outliers that are in need of sample preparation mistakesDid someone forget to put HCl in during the digestion process?
10 By running your eye over the IntelliQuant results, shown as a heat map on the right, you can quickly identify whether Cl is present and know that the digestion was done correctly. The same approach can be used for most acids used for sample digestion. Elements shaded red are in high concentration, orange are in mid-range concentration, and those in yellow are in low concentration. Unshaded elements are not at detectable levels in the sample. In this case, Cl is missing, indicating that HCl was not used during sample alerts to reduce downtime and maintenance costs Smart Instrument Health TrackingAvoid downtime and wasted time with the right amount of maintenanceInsufficient maintenance of an ICP-OES can lead to costly unplanned downtime, or analysis failures that cause time-wasting sample remeasurement.