Transcription of AN INTRODUCTION TO THE SHOCK RESPONSE …
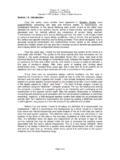
1 1 AN INTRODUCTION TO THE SHOCK RESPONSE spectrum Revision S By Tom Irvine Email: July 9, 2012 _____ INTRODUCTION Spacecraft and launch vehicle components encounter mechanical SHOCK from a variety of sources. Components must be designed and tested accordingly to ensure reliability. For example, engineers must anticipate transportation and shipping SHOCK . Consider an avionics component encased in foam packing material inside a shipping container. The container is placed on a truck which runs over a speed bump or a railroad track at an imprudent speed. The avionics component may receive a half-sine SHOCK pulse. This type of pulse can be readily represented in the time domain by its duration and peak amplitude.
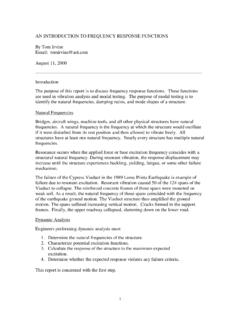
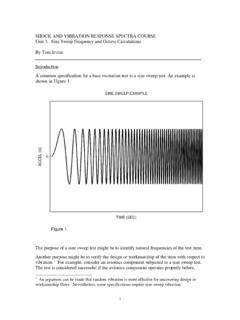
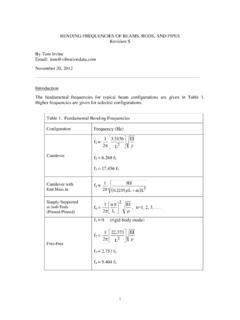
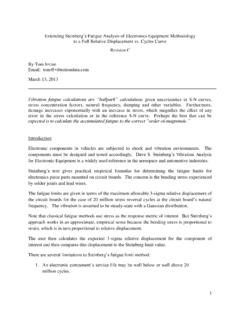
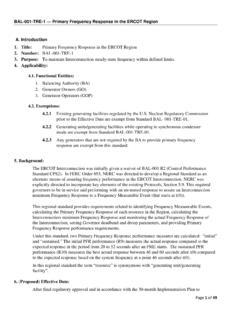
2 Also, reproduction of this pulse in an environmental test lab is usually straightforward. Eventually, the avionics component is integrated into a spacecraft. The component must now withstand a series of flight SHOCK pulses. These pulses result from rocket motor ignition, staging, and deployment events. Linear shape charge and pyrotechnic devices are typically used to initiate staging events. These devices produce high-frequency, high-amplitude SHOCK energy as a by-product. A typical pyrotechnic pulse is shown in Figure 1. The corresponding SHOCK RESPONSE spectrum is given in Figure 2. Figure 1. (SEC)ACCEL (G)TYPICAL SPACE VEHICLE PYROTECHNIC SHOCK 2 Figure 2.
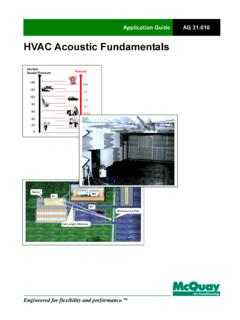
3 SHOCK RESPONSE spectrum of a Pyrotechnic Input Pulse Note that the SHOCK RESPONSE spectrum is displayed in terms of its positive and negative spectral curves. This format is sometimes used to evaluate the integrity of the pulse. Ideally, the two curves should be approximately equal, as is the case in this example. Note that the input pulse was measured during a pyrotechnic development test. The pyrotechnic pulse in Figure 1 was measured during a nosecone fairing separation test performed on the ground. It is the result of ordnance detonation and the sudden release of strain energy from a clamp band. One of the purposes of this test was to measure SHOCK levels at component mounting locations so that proper component test levels could be derived.
4 Note that pyrotechnic SHOCK energy is a serious concern for electronic components. This energy could cause a crystal oscillator to shatter, for example. It could also cause a relatively large component, such as a DC-to-DC converter, to detach from a circuit board. The pyrotechnic pulse in Figure 1 is a complex waveform. It tends to oscillate in a somewhat symmetric manner about the zero baseline. Its overall envelope has an exponential decay, although some lingering reverberation is also present. Unlike the transportation SHOCK pulse, this pyrotechnic pulse is too complicated to represent by a time domain mathematical function.
5 Engineers need some other tool to understand the effect of the pyrotechnic SHOCK on spacecraft components. 11010010001000010100100010000 NegativePositiveNATURAL FREQUENCY (Hz)PEAK ACCEL (G) SHOCK RESPONSE SPECTRA Q=10 TYPICAL SPACE VEHICLE PYROTECHNIC SHOCK 3 Furthermore, reproduction of the pyrotechnic pulse for a component qualification test would be virtually impossible. This is particularly true if a mechanical test method is used to simulate the pyrotechnic event. Another approach is needed for testing. The SHOCK RESPONSE spectrum is a useful tool for estimating the damage potential of a SHOCK pulse, as well as for test level specification.
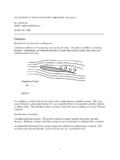
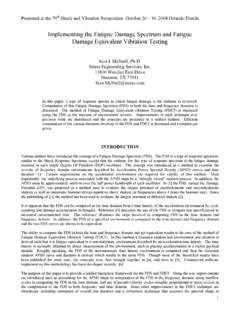
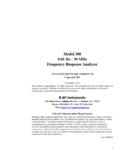
6 Note that MIL-STD-1540C and MIL-STD-810E require this format for certain SHOCK environments. The purpose of this report is to explain the SHOCK RESPONSE spectrum and to give a derivation of a calculation method. The calculation method is carried out in the time domain via a convolution The end result is represented in terms of the natural frequency domain, however, as shown in Figure 2. SHOCK RESPONSE spectrum MODEL The SHOCK RESPONSE spectrum is a calculated function based on the acceleration time history. It applies an acceleration time history as a base excitation to an array of single-degree-of-freedom (SDOF) systems, as shown in Figure 3 Note that each system is assumed to have no mass-loading effect on the base input.
7 Y (Base Input).. <<<<..fn2fn3fnL Figure 3. SHOCK RESPONSE spectrum Model Y is the common base input for each system, and X is the absolue RESPONSE of each system to the input. The double-dot denotes acceleration. M is the mass, C is the dampingcoefficient, and K is the stiffness for each system. f is the natural frequency for 1 There is an equivalency between the convolution integral and the multiplication of Fourier transforms. Thus, the calculation process can be carried out in terms of Fourier transforms. This equivalent process requires additional calculation steps, however. The industry preference is thus the convolution method.
8 4 The damping of each system is typically assumed as 5%, which is equivalent to Q = 10. The natural frequency is an independent variable. Thus, the calculation is performed for a number of independent SDOF systems, each with a unique natural frequency. Any arbitrary set of unique natural frequencies can be used for the SHOCK RESPONSE spectrum calculation. A typical scheme, however, is based on a proportional bandwidth, such as 1/6 octave. This means that each successive natural frequency is 2 1/6 times the previous natural frequency. Thus, a sample set of N calculation frequencies in units of Hertz would be 10.
9 , [10][2(1/6)(N-1) ]. Note that the bandwidth increases with frequency. Each of the natural frequencies in the above example represents the center frequency of an octave band. Continuing with the 1/6 octave format, the following relationships hold for the upper frequency fu and the lower frequency fl: fl = [fc]/[ 2 1/12 ], fu = [fc ][2 1/12 ], where fc is the center frequency. The Hz band thus has lower and upper limits of Hz and Hz, respectively. The peak acceleration for a particular frequency is the exact value for that exact frequency, For simplicity, the peak value may be assumed to be the same for any frequency in a given band, or the peak for an off-center frequency may be found by interpolation between two adjacent center frequencies.
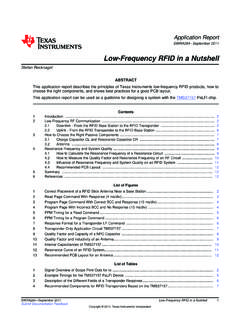
10 HALF-SINE EXAMPLE Each SDOF system has a unique time history RESPONSE to a give base input. An example is shown in Figure 4. Note that the RESPONSE calculation is carried out via a convolution integral, as explained later in the text. The SHOCK RESPONSE spectrum is the peak absolute acceleration RESPONSE of each SDOF system to the time history base As an alternative, this function can be represented in terms of its peak positive and peak negative responses. The dimensions are peak RESPONSE (G) versus natural frequency (Hz). Figure 5 shows the SHOCK RESPONSE spectrum corresponding to the example in Figure 4. 2 In contrast, the level at a center frequency in a random vibration power spectral density represents the average mean square level across the band.