Transcription of ANALYSIS OF PLANT PIGMENTS USING PAPER …
1 ULTRAVIOLET/VISIBLE SPECTROSCOPY PURDUE UNIVERSITY INSTRUMENT VAN PROJECT ANALYSIS OF PLANT PIGMENTS USING PAPER CHROMATOGRAPHY AND VISIBLE AND/OR UV SPECTROSCOPY (1-31-96) INTRODUCTION We have seen that all cells must constantly consume fuel molecules to maintain themselves, grow, and reproduce. Fuel molecules such as glucose constitute an immediate source of energy for biological work that can be released by catabolic cell processes. However it is necessary that life on earth have a constant source of energy that can be harvested and used to generate complex fuel molecules from simple starting materials. The ultimate energy source upon which all life forms depend is visible light from the sun. Light energy must first be transformed into chemical(bond) energy before it can be utilized by the living cell. This transformation is achieved only in the cells of green plants and certain bacteria. In green plants it is coupled with a transformation of matter in which relatively low-energy compounds, carbon dioxide and water, are converted into high energy chemical molecules that become subunits of carbohydrates.
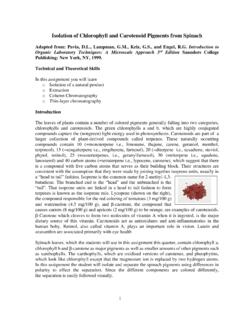
2 There are four different pigment groups present in leaves of photosynthesizing plants . Studies indicate that only the chlorophyll IS involved in the actual absorption of light energy and later conversion to chemical energy of living cells. The other PIGMENTS also absorb light energy, but it is transferred to the chlorophyll for conversion to chemical energy. Biochemists have developed a variety of methods for the purification and ANALYSIS of biomolecules. Several of these techniques will be used in this laboratory exercise in order to isolate and study the photosynthetic PIGMENTS , chlorophyll a, chlorophyll b, and carotenoids. These include PAPER chromatography and spectrophotometry. PAPER chromatography separates compounds on PAPER as solvent carries the mixture up (or down) the PAPER by capillary action. Compounds which are very soluble in the solvent move along with the advancing solvent front, while less soluble compounds travel slowly through the PAPER , well behind the solvent front.
3 As a result, the different compounds are separated on the basis of their solubilities in the chosen solvent. Chlorophyll a is slightly soluble in a 3:1:1 mixture of petroleum ether, acetone, and water. Carotenoids are very soluble in this solvent system. These solubility differences will allow the separation of chlorophyll a from the carotenoids and chlorophyll b on a PAPER chromatogram. Having purified chlorophyll a, chlorophyll b, and the carotenoids, you will examine the light absorption characteristics of the molecules USING a spectrophotometer, an instrument which ULTRAVIOLET/VISIBLE SPECTROSCOPY PURDUE UNIVERSITY INSTRUMENT VAN PROJECT measures the absorption of light by a solution at any wavelength(s) selected by the experimenter. Light visible to the human eye occupies only a small portion of the electromagnetic spectrum, namely from about 350 to 750 nanometers, or from violet to red. The color of light is also related to the energy of the light as shown below.
4 <-------------------------visible light ---------------------> color: UV violet blue green yellow red IR <--------------------------------------------------------------------------------------------------> 300 400 500 600 700 800 high energy light low energy light Spectrophotometers and related devices can "sense" not only visible light but other wavelengths such as ultraviolet as well. The instrument is set to read a certain wavelength and the instrument reports the amount of light absorbed by the solution at the set wavelength. Obviously by changing the wavelength setting over the entire range, we can obtain the visible or visible-ultraviolet light absorption spectrum for any solution or compound. PURPOSE To separate PIGMENTS from leaves of a green PLANT USING PAPER chromatography and to determine the wavelength at which energy is absorbed by the individual PIGMENTS USING spectrophotometry.
5 SAFETY Goggles and aprons to be worn Petroleum ether, acetone and alcohol are volatile and flammable Avoid breathing vapors of the reagents Handle microcuvets by grooved sides only PRE-LAB QUESTIONS 1. Why is energy required for life? 2. How does energy enter the living world? 3. Visible white light is composed of what? 2 ULTRAVIOLET/VISIBLE SPECTROSCOPY PURDUE UNIVERSITY INSTRUMENT VAN PROJECT 4. Which wavelength of visible light possesses the greatest energy value, and what is its color? 5. Which wavelength possesses the least energy value, and what is its color? 6. Which pigment(s), chlorophyll a, chlorophyll b, and/or carotenoids, will travel the farthest on the chromatography PAPER ? 7. Which pigment(s) is least soluble in the solvent? 8. If the transmittance is 100% what would be the absorbance? 9. If the absorbance is 2 what would be the % transmittance? EQUIPMENT AND MATERIALS NEEDED 2 or 3 fresh spinach leaves wooden ruler 600 mL beaker plastic wrap chromatography PAPER or filter PAPER pencil copper penny coin 100 mL graduated cylinder 5 test tubes scissors stapler 3 spectrophotometer cuvets graph PAPER optical wipes isopropyl alcohol petroleum ether acetone distilled water visible spectrophotometer (400-900 nm) Optional: Beckmann DU64 spectrophotometer/4 microcuvets (polystyrene) 3 ULTRAVIOLET/VISIBLE SPECTROSCOPY PURDUE UNIVERSITY INSTRUMENT VAN PROJECT PROCEDURE DAY ONE Work in teams of two for this activity Make sure work area is clean and dry.
6 Preparation of the sample: Note: Since oils from skin affect the separation, it is desirable to handle PAPER as little as possible. 1. Cut a piece of Whatman #1 filter PAPER or chromatography PAPER to the dimensions of 12 cm X 14 cm. Edges must be straight. 2. With a pencil lightly make a line - 2 cm from the bottom edge of the PAPER which measures 14 cm. 3. Select 2 large dark green spinach leaves and blot dry with PAPER towels. Place a leaf over the pencil line leaving 3 mm on each end to align the ruler. 4. Place the widest side of a wooden ruler (without metal edge) over the leaf so that it covers the pencil line on either end. 5. USING a penny coin, press down firmly and roll along the ruler edge several times to form a definite green line. 6. Allow the green line to dry 7. Move leaf down and repeat several times until the pencil line is covered completely with a narrow green band. Be careful not to smear this green line. Separation of PIGMENTS : 1.
7 Roll 12 cm edges together to form a cylinder with the green line on the outside - do not 4 ULTRAVIOLET/VISIBLE SPECTROSCOPY PURDUE UNIVERSITY INSTRUMENT VAN PROJECT overlap edges. 2. Staple top and bottom to form a cylinder. 3. Obtain 20 mL of the separation solvent and pour into a 600 mL beaker. 4. Place PAPER cylinder in beaker with the green band down. The solvent should not touch the green line. 5. Cover the beaker tightly with a piece of plastic wrap being careful not to slosh solvent. 6. Allow to stand undisturbed for 5 minutes. 7. After five minutes lift up corner of wrap and reseal. This will reduce the vapor pressure inside the beaker. 8. Observe the solvent movement and band separation. 9. When the solvent front is within 1 cm of the upper edge of the PAPER , remove the cylinder from the beaker. Mark the edge of the solvent front with a pencil. 10. Allow the cylinder to dry completely in a darkened area. 11.
8 Discard the solvent from the 600 mL beaker into the waste container in the fume hood followed by three volumes of water. Extraction of PIGMENTS : 1. Open the dried cylinder by removing the staples. 2. Measure distance from the first pencil line to the solvent front. Then measure the distance from the pencil line to the highest point of each color band and the original pencil line band. Record your results. 3. Ideally there should be three distinct colored bands. Cut the bands apart carefully and trim off excess PAPER being careful not to cut colored band. 4. Cut each strip into pieces small enough to fit into a large test tube. Label each tube and 5 ULTRAVIOLET/VISIBLE SPECTROSCOPY PURDUE UNIVERSITY INSTRUMENT VAN PROJECT record the color and order of pigment. Place PAPER pieces in the appropriate test tubes. 5. Add 5 mL of isopropyl alcohol to each tube and seal with small piece of plastic wrap. Allow to stand until color is completely eluted from the PAPER .
9 STOPPING POINT! 6. Calculate rf values for each pigment. The rf values should be written on the chalkboard. rf = distance color travels distance solvent front travels DAY TWO UPON ENTERING LAB TURN THE POWER CONTROL KNOB ON THE SPECTROPHOTOMETER TO THE "ON" POSITION Preparation of samples for spectrophotometric ANALYSIS 1. Fill to 1/3 a spectrophotometer cuvet with isopropyl alcohol. Label "bl" USING a marking pen. This is the blank used to standardize the spectrophotometer. 2. Transfer solution from test tube containing chlorophyll a pigment to a second spectrophotometer cuvet. Label "a". 3. Transfer solution from test tube containing chlorophyll b PIGMENTS to a third cuvet. Label "b". 4. Transfer solution from test tube containing carotene PIGMENTS to a fourth cuvet. Label "c". 5. Wipe sides of cuvet with Accuwipe and avoid touching surfaces with fingers. Be sure that the label does not interfere with the path of the light beam.
10 Measuring absorbance of PIGMENTS 1. Turn wavelength control knob to 360 nm. If USING Flinn spectrophotometer, turn dial on lower front of case to the blue filter. 2. With the sample chamber lid closed set the 0 % transmittance to 0. 3. Insert cuvet labeled "bl" into the sample chamber and close lid. Set the 100% transmittance to 100% and remove cuvet. 6 ULTRAVIOLET/VISIBLE SPECTROSCOPY PURDUE UNIVERSITY INSTRUMENT VAN PROJECT 4. Insert cuvet "a" into sample chamber, close lid and read the ABSORBANCE shown. Record results. Remove cuvet. 5. Insert cuvet "b" into sample chamber, close lid and read the ABSORBANCE shown. Record results. Remove cuvet. 6. Insert cuvet "c" into sample chamber, close lid and read the ABSORBANCE shown. Record results. Remove cuvet. 7. Turn wavelength control knob to 380 nm. 8. Continue to record results for wavelengths at 20 nm increments, remember to repeat steps #2-6 for each new wavelength. The final reading is 720 nm. If USING the Flinn spectrophotometer, change to the yellow filter at 520 nm.