Transcription of Atomic Force Microscopy - asdlib.org
1 introduction to scanning Probe Microscopy (SPM) Basic Theory Atomic Force Microscopy (AFM) Robert A. Wilson and Heather A. Bullen,* Department of Chemistry, Northern Kentucky University, Highland Heights, KY 41099. Outline How does the AFM work? How are forces measured? - Spring Constants - Probes - Instrumentation Imaging Methods What types of forces are measured? Modes of Operation -Contact -Non-contact -Tapping What are Force curves? What are the limitations of AFM? 1 This work is licensed under a Creative Commons Attribution-Noncommercial-Share Alike License and contains web-linked material.
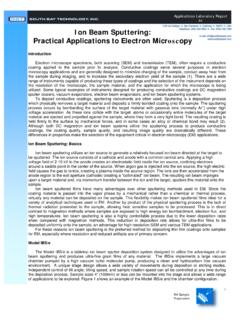
2 * corresponding author: 859-572-5411 Atomic Force Microscopy HOW DOES THE AFM WORK? AFM provides a 3D profile of the surface on a nanoscale, by measuring forces between a sharp probe (<10 nm) and surface at very short distance ( nm probe-sample separation). The probe is supported on a flexible cantilever. The AFM tip gently touches the surface and records the small Force between the probe and the surface. How are Forces Measured? SpringSampleTipBATipSpringSampleTipBASpr ingSampleTipBATipThe probe is placed on the end of a cantilever (which one can think of as a spring). The amount of Force between the probe and sis dependant on the spring constant (stiffnessof the cantilever and the distance between thprobe and the sample surface. This Force canbe described using Hooke s Law: ample ) e F=-k x F = Force the spring constant of cantilever (typically ~ N/m) is less than surface, the Figure 1.
3 A) Spring depiction of cantilever b) SEM image of triangular SPM cantilever with probe (tip). (Image from MikroMasch)1 k = spring constant x = cantilever deflection Ifcantilever bends and the deflection is monitored. T-9his typically results in forces ranging from nN (10) to N (10-6) in the open air. hat are probes made of? W om Si3N4, or Si. Different cantilever lengths, nd at al Probes are typically made frmaterials, and shapes allow for varied spring constants and resonant frequencies. A description of the variety of different probes can be fouvarious vendor Probes may be coated with other materials for additionSPM applications such as chemical Force Microscopy (CFM) and magnetic Force Microscopy (MFM). 2 Instrumentation The motion of the probe across the surface is controlled similarly to the STM using feedback loop and piezoelectronic scanners.
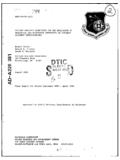
4 (See STM basic theory) The primary difference in instrumentation design is how the forces between the probe and sample surface are monitored. The deflection of the probe is typically measure by a beam bounce method. A semiconductor diode laser is bounced off the back of the cantilever onto a position sensitive photodiode detector. This detector measures the bending of cantilever during the tip is scanned over the sample. The measured cantilever deflections are used to generate a map of the surface topography. LaserPhotodiode DetectorPiezoelectricScannerCantileverwi th ProbeFeedback ElectronicsSiO2 text (1 nm high) on SisampleLaserPhotodiode DetectorPiezoelectricScannerCantileverwi th ProbeFeedback ElectronicsSiO2 text (1 nm high) on SiSiO2 text (1 nm high) on Sisample Figure 2. Schematic of AFM instrument showing beam bounce method of detection using a laser and position sensitive photodiode detector.
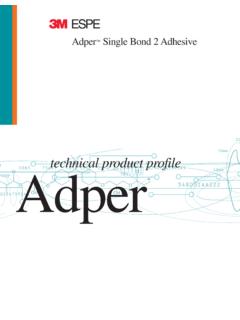
5 For a visual depiction of the beam bounce method of detection in AFM and you can refer to the following web resource which utilizes Legos , magnetics, and a laser pointer to demonstrate this concept. 3 Imaging Methods What types of forces are measured? The dominant interactions at short probe-sample distances in the AFM are Van der Waals (VdW) interactions. However long-range interactions ( capillary, electrostatic, magnetic) are significant further away from the surface. These are important in other SPM methods of analysis. During contact with the sample, the probe predominately experiences repulsive Van der Waals forces (contact mode). This leads to the tip deflection described previously. As the tip moves further away from the surface attractive Van der Waals forces are dominant (non-contact mode). ForceContact ModeNo n-Co ntact ModeTappingModeTappi ngModeProbe-Sample Separationrepulsive forceattractive forceForceContact ModeNo n-Co ntact ModeTappingModeTappi ngModeProbe-Sample Separationrepulsive forceattractive Force Figure 3.
6 Plot of Force as a function of probe-sample separation. Modes of Operation There are 3 primary imaging modes in AFM: (1) Contact AFM < nm probe-surface separation (2) Intermittent contact (tapping mode AFM) nm probe-surface separation (3) Non-contact AFM nm probe-surface separation 4 Primary Modes of Imaging: 1. Contact Mode AFM: (repulsive VdW) When the spring constant of cantilever is less than surface, the cantilever bends. The Force on the tip is repulsive. By maintaining a constant cantilever deflection (using the feedback loops) the Force between the probe and the sample remains constant and an image of the surface is obtained. Advantages: fast scanning , good for rough samples, used in friction analysis Disadvantages: at time forces can damage/deform soft samples (however imaging in liquids often resolves this issue) 2.
7 Intermittent Mode (Tapping): The imaging is similar to contact. However, in this mode the cantilever is oscillated at its resonant frequency, Figure 4. The probe lightly taps on the sample surface during scanning , contacting the surface at the bottom of its swing. By maintaining a constant oscillation amplitude a constant tip-sample interaction is Oscillation Amplitude: 20-100 nm maintained and an image of the surface is obtained. Advantages: allows high resolution of samples that are easily damaged and/or loosely held to a surface; Good for biological samples Disadvantages: more challenging to image in liquids, slower scan speeds needed Figure 4. Resonant frequency is a natural frequency of vibration determined by the physical parameters of the vibrating object. For example if you hit a spring with a mass at the end (probe) the main response will be a bob up and down at its natural frequency.
8 3. Non-contact Mode: (attractive VdW) The probe does not contact the sample surface, but oscillates above the adsorbed fluid layer on the surface during scanning . (Note: all samples unless in a controlled UHV or environmental chamber have some liquid adsorbed on the surface). Using a feedback loop to monitor changes in the amplitude due to attractive VdW forces the surface topography can be measured. Advantages: VERY low Force exerted on the sample(10-12 N), extended probe lifetime Disadvantages: generally lower resolution; contaminant layer on surface can interfere with oscillation; usually need ultra high vacuum (UHV) to have best imaging 5 What are Force Curves? Force curves measure the amount of Force felt by the cantilever as the probe tip is brought close to - and even indented into - a sample surface and then pulled away.
9 In a Force curve analysis the probe is repeatedly brought towards the surface and then retracted, Figure 5. Force curve analyses can be used to determine chemical and mechanical properties such as adhesion, elasticity, hardness and rupture bond lengths. Deflection (V)Z ( m) Force Curve to ContactTip is FreeABCDABCDD eflection (V)Z ( m) Force Curve to ContactTip is FreeJump to ContactTip is FreeTip is FreeABCDABCD Figure 5. A typical Force curve showing the various probe-sample interactions. The slope of the deflection (C) provides information on the hardness of a sample. The adhesion (D) provides information on the interaction between the probe and sample surface as the probe is trying to break free. Direct measurements of the interactions between molecules and molecular assemblies can be achieved by functionlizing probes with molecules of interest (see Chemical Force Microscopy ).
10 Interactive Tools: An interactive Force curve analysis can be found here: 6 WHAT ARE THE LIMITATIONS OF AFM? The AFM can be used to study a wide variety of samples ( plastic, metals, glasses, semiconductors, and biological samples such as the walls of cells and bacteria). Unlike STM or scanning electron Microscopy it does not require a conductive sample. However there are limitations in achieving Atomic resolution. The physical probe used in AFM imaging is not ideally sharp. As a consequence, an AFM image does not reflect the true sample topography, but rather represents the interaction of the probe with the sample surface. This is called tip convolution, Figure 6. surfaceTip pathHigh aspecttipLow aspecttipsurfaceTip pathHigh aspecttipLow aspecttip Figure 6. Ideally a probe (tip) with a high aspect ratio will give the best resolution.