Transcription of BAYESIAN METHODS FOR CONTROL LOOP MONITORING …
1 BAYESIAN METHODS FOR CONTROL LOOPMONITORING AND DIAGNOSISBiao Huang ,1 Department of Chemical and MaterialsEngineering,University of Alberta, Edmonton, ABT6G 2G6, CanadaAbstract: There exist many algorithms for CONTROL performance MONITORING . Thereare also many algorithms available for process MONITORING . There are, however,few METHODS available for synthesis of various MONITORING technologies to form adiagnosing system for optimal decision making. This paper is concerned with estab-lishing and demonstrating a novel probabilistic diagnostic framework for controlloop MONITORING . The new framework possesses a number of desired properties in-cluding, for example, probabilistic diagnosing procedure, flexibility in synthesizingdifferent MONITORING technologies, robustness in the presence of missing data ormissing variables, ease of expansion or shrinking of the diagnosing system, abilityto incorporatea prioriprocess knowledge, and capability for decision the backbone of the proposed framework, the emerging BAYESIAN METHODS areintroduced and shown to be the appropriate tools.
2 Several representative controlloop diagnostic problems are formulated under the BAYESIAN framework and theirsolutions are demonstrated through examples. The experiences and challengeslearned from industrial applications of BAYESIAN METHODS are summarized andsome of future research directions are 2007 IFACK eywords: BAYESIAN METHODS , performance assessment, diagnosis , controlmonitoring, process MONITORING , BAYESIAN network1. INTRODUCTIONE stablished in later 1980s by [Harris, 1989], theresearch on CONTROL loop MONITORING has been andremains to be one of the most active research areasin process CONTROL community. A number of algo-rithms have been developed and many successfulapplications have been reported; see reviews by[Qin, 1998; Huang and Shah, 1999; Harris et al.]
3 ,1999; Jelali, 2006]. It is estimated that severalhundreds of papers have published in this or re-lated direction [Horch and Dumont, 2003]. On thepractical side, Eastman Kodak recently reported1 Corresponding author; Tel: +1(780)492-9016, Fax:+1(780)492-2881, E-mail: loop MONITORING on over 14000 PID commercial CONTROL performance assessmentsoftware including multivariate performance as-sessment has also been available in the the significant progress is being made incontrol performance MONITORING , other related de-velopments also go hand in hand including, sen-sor MONITORING [Jelali, 2006], actuator MONITORING [Horch, 2000], oscillation detection [Thornhill andHagglund, 1997; Horch, 2000], model validation[Huang et al., 2003], model predictive controlmonitoring [Kesavan and Lee, 1997; Schafer andCinar, 2004], nonlinearity detection [Choudhuryet al.
4 , 2004] etc. Most of MONITORING methodstarget specific problem in a CONTROL loop and suc-cessful case studies have been reported. However,the synthesis of these MONITORING technologies hasrarely been addressed. The common practice wasthat one MONITORING algorithm was developed forspecific problem and then tested with the targetedproblem. Obviously, different problems can resultin similar symptoms and may affect more than onemonitoring algorithms. There is a need to considervarious MONITORING problems simultaneously in asystematic are a number of challenging issues insynthesizing MONITORING problems: 1) While thesource of the problem may be unique ( changeof disturbance dynamics), its symptoms can besimilar to that resulted from different problemsources ( change of the plant model).
5 Themodel validation algorithm that is designed to de-tect plant-model mismatch can not immune fromdisturbance model change. Thus, while each mon-itoring algorithm may work well when only thetargeted problem occurs, relying on a single mon-itoring algorithm can be misleading in general. Forexample, change of the disturbance model may bediagnosed as change of the plant model if onlythe plant model validation algorithm is applied. 2)To resolve this issue, one needs to investigate howproblem sources can affect each others monitoringalgorithm. Probabilistic dependence of each mon-itoring algorithm on all problem sources has tobe investigated in order to achieve this ) All processes operate, to a certain degree, inan uncertain world. The occurrence of a problem,its symptom, and its interconnection with otherproblems/symptoms all have some solution has to be built upon a probabilisticframework.
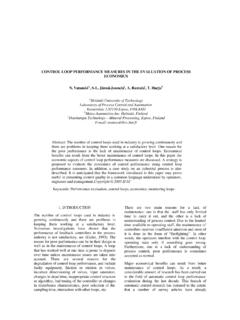
6 Thus, a joint probability distributionamong all problem sources as well as all symptomsdetected need to be established. As elaboratedshortly, the computation of the probabilities andstatistical inferences grows exponentially with thenumber of problem sources and observed symp-toms. 4) Most of the existing MONITORING meth-ods are data based. While they have advantagesof simplicity, it is obvious that certaina prioriknowledge of process is not only helpful but alsonecessary when multiple problem sources are con-sidered. For example, a process flow chart indicat-ing components interrelationship may be availableand should be considered in making a meaning-ful diagnosis and decision. It is of a considerablechallenge to integrate data based algorithms witha view of problems raised above, a novel proba-bilistic framework to synthesize various monitor-ing technologies for CONTROL loop and instrumentmonitoring/ diagnosis is developed in this BAYESIAN model also known as graphical model[Murphy, 2002], elaborated shortly, is a suitableframework for solving such 1.
7 Block diagram of CONTROL loop2. PROBLEM STATEMENTAn example of the processes to be consdered isshown in , whereC,V,G,N,Mrepresentthe controller, actuator, plant, disturbance, andsensor, respectively. For illustration, we make thefollowing assumptions: The CONTROL lawCneeds not to be known andmay be a PID or an optimization based con-strained CONTROL law such as model predictivecontrol. Noise modelNis varying among a set ofmodels. The nominal plant modelGis unknownexcept for the case of model validation. Both actuatorVand sensorMare subject tofault (or problem). For example, the actuatormay be subject to stiction and sensor may besubject to bias loop performance is the primary interestof this work and it can vary due to various reasonssuch as change in the plant, in the controller,and/or in disturbance dynamics, or simply dueto faults in the sensors or further assume that certain monitors are avail-able.
8 Every monitor is, however, subject to distur-bances and thus false alarms, and each monitorcan be sensitive to other faults that are not sup-posed for this monitor to look after. For example,the model monitor may be sensitive to valve non-linearity although it is designed to monitor theplant model ESTABLISHING A NOVEL FRAMEWORKFOR CONTROL LOOP DIAGNOSISAs has been discussed in the last section, a typicalcontrol loop consists of at least four components,sensor, actuator, controller and plant, each sub-ject to possible performance degradation or problem in one of these four components canaffect CONTROL loop performance . Each of them hasits MONITORING algorithms to monitor the problemsand these algorithms may all be affected by one ormore of the four components.
9 Imagine a simplestnetwork of eight nodes, representing four compo-nents and four monitors, and their relations aredescribed by conditional probabilities. To com-pletely determine the relation among all nodes,one needs to know the joint probabilities ofeightrandom variables. With increased components tobe considered and monitors to be added, thecomplexity of the network can quickly go beyondcomputational possibility. The emerging Bayesiangarphic model (or simply called BAYESIAN modelin the sequel), which exploits the independenceof random variable network, is the choice of themethod that sheds a light on the problem building block of the BAYESIAN model is a net-work of nodes connected by conditional probabili-ties. These nodes are random variables, which canbe continuous, discrete or even binary.
10 Considerthe simplest binary random variables. If there arenbinary random variables, the complete distribu-tion is specified by 2n 1 joint probabilities. In theillustrative Fig. 2, there are 4 binary nodes, eachnode having two possible outcomes. For example,node A may take the valueAor A. To completelydetermine the distribution of the 4 binary vari-ables, one needs to determine joint probabilityP(A, B, C, D) that has 16 outcomes. By takingaccount that sum of all probabilities must equalto 1, one needs to calculate 15 probabilities. How-ever, as illustrated in Fig. 2, by exploring therelationship of each node, only 7 probabilities needto be determined, a considerable reduction from15. The saving comes from exploiting the condi-tional independence between certain variables ( arcs between certain variables).