Transcription of blue solutions 09 - Demarest
1 Chapter 9 Copyright Big Ideas Learning, LLC Big Ideas Math blue All rights reserved. Worked-Out solutions 283 Chapter 9 Opener Try It Yourself (p. 371) 1 4. 1. To plot ()1, 3 , start at the origin and move 1 unit right and 3 units up. The point is in Quadrant I. 2. To plot ()2, 4 , start at the origin and move 2 units left and 4 units up. The point is in Quadrant II. 3. To plot ()1, , start at the origin and move 1 unit right and units down. The point is in Quadrant IV. 4. To plot 311, 2 ,44 start at the origin and move 314 units left and 124 units down. The point is in Quadrant III. 5. ()212184 41314yymxx ==== ()()()1141 1415yy mxxyxyxyx = = =+=+ 6. ()2121211180 8 8yymxx ==== ()()()111108118118yy mxxyxyxyx = = +== 7.
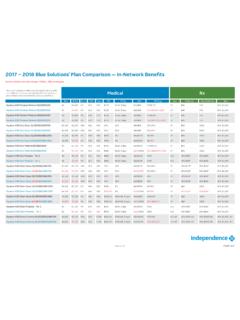
2 212198 17 1736 3 3yymxx ==== ()()111786317834317263yy mxxyxyxyx = = = = Section Activity (pp. 372 373) 1. a. Sample answer: b. ()()()()()()21, 30 , 5, 9 , , , 16, 28 , 2, 8 , , 7 , ()()()15, 27 , 7, 12 , 10, 26 c. Sample answer: As weight increases, the circumference increases. Yes, there appears to be two clusters of data points. d. You can describe the relationship as positive because as x increases, C increases. You can describe the relationship as linear because the data points lie close to a line. e. The ordered pair that represents the bowling ball is ()225, 27 . This data point is far removed from the other points. It is an outlier. 4yx 4 3 2O112 234234(1, 3)( 2, 4)(1, )( 1 , 2 )1434Cx18153691215182124273021 24 27303 6 9 12 Weight (ounces)Circumference (inches)Cx18153691215182124273021 24 27303 6 9 12 Weight (ounces)Circumference (inches)Chapter 9 Big Ideas Math blue Copyright Big Ideas Learning, LLC Worked-Out solutions All rights reserved.
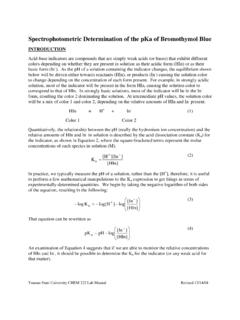
3 284 2. a. ()()()()()()0, 95 , 3, 88 , 2, 90 , 5, 83 , 7, 79 , 9, 70 , ()()()()()4, 85 , 1, 94 , 2, 90 , 10, 65 , 8, 75 b. Sample answer: As the number of absences increases, the final grade decreases. It is similar because these data points also lie close to a line. It is different because the data points are falling from left to right. c. Sample answer: The points ()5, 83 and ()7, 79 are on the graph. When 6,x= the y-value should be between 79 and 83. So, an estimate for a student who has been absent 6 days is a final grade of 80. 3. a. ii; There is no relationship between month of birth and birth weights of infants. So, the points should show no pattern. b. i; Because students who did well on the quiz will most likely do well on the test, as the quiz scores increase, so will the test scores.
4 C. iii; As the age of the laptop computer increases, the value will decrease. 4. Sample answer: A scatter plot is a graph that shows the relationship between two data sets. 5. To construct a scatter plot, use the horizontal axis of a coordinate plane to represent one of the data sets. Use the vertical axis to represent the other data set. Write the ordered pairs that represent the data. Then plot the ordered pairs on your coordinate plane. Once the ordered pairs are plotted, you can determine whether the points show a positive or negative relationship, a linear or nonlinear relationship, and whether there are any clusters or gaps in the data. You can also use a scatter plot to identify any outliers, points that are far from the other data points.
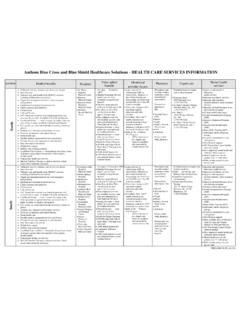
5 On Your Own (pp. 374 375) 1. Sample answer: Draw a vertical line from the point that has a y-value just below 650. It crosses the x-axis at about 33. So, a sandwich with 650 calories might have about 35 grams of fat. 2. As the study time increases, the test score increases. So, the scatter plot shows a positive linear relationship. There is a gap in the data from 90 to An outlier on the graph is ()120, 70 . There are no obvious clusters. Exercises (pp. 376 377) Vocabulary and Concept Check 1. The data must be ordered pairs so there are equal amounts of x- and y-values. 2. An outlier is a data point that is far removed from the other points in a data set. 3. A student's shoe size is not related to their IQ. So, you would expect no relationship between the data.
6 4. As time passes, the distance to the destination decreases. So, you would expect a negative linear relationship between the data. 5. On each successive bounce, the ball rebounds to a height less than its previous bounce. So, you would expect a nonlinear relationship between the data. 6. As the number of toppings increases, the price of the pizza will increase. So, you would expect a positive linear relationship between the data. Practice and Problem Solving 7. a. ()()()()()22, 152 , 40, 94 , 28, 134 , 35, 110 , 46, 81 b. As the average price of jeans increases, the number of pairs of jeans sold decreases. yx65102030405060708090100789101234 AbsencesFinal grade06065707580859095100y02040608010012 0xStudy time (minutes)Test scoreyx30252040608010012014016035 40 455 10 15 20 Average pricePairs of jeans soldChapter 9 Copyright Big Ideas Learning, LLC Big Ideas Math blue All rights reserved.
7 Worked-Out solutions 285 8. a. Draw a vertical line from the point that has a y-value of 1000. It crosses the x-axis at 2011. So, 1000 SUVs were sold in 2011. b. Draw a horizontal line from the point that has an x-value of 2013. It crosses the y-axis at about 875. So, in 2013, about 875 SUVs were sold. c. As the year increases, the number of SUVs sold decreases. So, the scatter plot shows a negative linear relationship. 9. a. The point at 3x=has a y-value below 70 and the point at 4x=has a y-value above 70, so a value between 3 and 4 will yield a y-value of 70. You can estimate that the server should work about hours to earn $70. b. Draw a horizontal line from the point that has an x-value of 5. It crosses the y-axis at about 85.
8 So, the server earned about $85 for 5 hours of work. c. As the hours worked increase, the earnings increase. So, the scatter plot shows a positive linear relationship. 10. As x increases, y decreases. So, the scatter plot shows a negative linear relationship. There is an outlier at (15, 10), and a gap between the x-values of 15 to 25 and y-values of 23 to 33. There are no clusters. 11. The points lie in a shape of a curve. So, the scatter plot shows a nonlinear relationship. There are no outliers, gaps, or clusters. 12. The points show no pattern. So, the scatter plot shows no relationship. There are no outliers, gaps, or clusters. 13. As the year increases, the price per pound for honey increases. So, the data show a positive linear relationship.
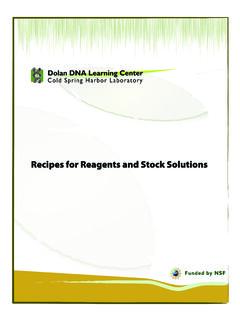
9 14. a. As the study times increase, the test scores increase. So, the scatter plot shows a positive linear relationship. b. The more time you spend studying, the higher the test score you will receive. 15. Sample answer: As the number of weeks a movie has been in theaters increases, the weekly movie ticket revenue decreases. 1 6 . a . The data show a weak positive linear relationship. b. Sample answer: The point ()32, 250 is an outlier because the store only offers one 32 GB 7-inch tablet and 32 GB is significantly greater than the other options. There are gaps between 4,x= 8,x= and 16x= because these are the only available options for memory. There are clusters along4,x= 8,x= and 16x=because these are the only available options for memory.
10 17. no; A relationship does not indicate a causation. There could be other factors such as sunny, warm weather. Fair Game Review 18. 526526xxyxyx=+==+ The graphs intersect at ()2, 10 . So, the solution is Check: 2x= ()()??5265222 6104 61010xx=+=+=+=9 yx 2124681012141623456(2, 10)y = 2x + 6y = 5xyx242020406080100120140160180200220240 28 324 8 12 16 Memory (GB)Price (dollars)Chapter 9 Big Ideas Math blue Copyright Big Ideas Learning, LLC Worked-Out solutions All rights reserved. 286 19. 7391373913xxyxyx+= =+= The graphs intersect at ()8, 59 . So, the solution is Check: 8x= ()()??73 91378 398 1356 372 135959xx+= += += =9 20. 2143323143xxyxyx= == The graphs intersect at 24, 2 .3 So, the solution is Check: 4x= ()()?