Transcription of Calculating Gain and Phase from Transfer Functions
1 1 Calculating Gain and Phase from Transfer FunctionsMECH 3140 Lecture # Transfer Functions A differential equation , , , ..= ( ), has as the input to the system with the output Recall that Transfer Functions are simply the Laplace Transform representation of a differential equation from input to output: ( ) = ( ) ( ) Therefore it can be used to find the Gain and Phase between the input and output2 Gain and Phase The gain and Phase are found by Calculating the gain and angle of the Transfer function evaluates at j = ( )= ( ) ( ) = = 3 Example #1 (solving the Diff Eq)Fall 2019 Exam #1, Bonus Problem: + = + =sin( )Recall we can represent a sinusoid in the following format: = 1 = Then taking the derivatives.
2 = = 1 + =1 +1 4 Example #1 (solving the Diff Eq)Solving for H (which is the output): = +1 +1 = = 2+12 2+12=15 Example #1 (using Transfer Function)Fall 2019 Exam #1, Bonus Problem: + = + =sin( )Take the Laplace of the entire equation and setting initial conditions to zero (since we are solving for the Transfer function): + = + ( ) +1= ( )( +1) ( ) ( )= +1 +16 Example #1 (using Transfer Function)Now, to find the gain simply evaluate the Transfer function at j ( ) ( )= +1 +1 = +1 +1= 2+12 2+12=17 Example #2 (solving the Diff Eq)Spring 2020 Exam #1, Bonus Problem: +25 = (t)Recall we can represent a sinusoid in the following format: = = Then taking the derivatives: = = ( )2 = 2 2 +25 = 8 Example #2 (solving the Diff Eq)Solving for H (which is the output): = 2+25 = =125 29 Example #2 (using Transfer Function)Spring 2020 Exam #1, Bonus Problem: +25 = (t)Take the Laplace of the entire equation and setting initial conditions to zero (since we are solving for the Transfer function).
3 2 +25 = ( ) 2+25= ( ) ( ) ( )=1 2+2510 Example #2 (using Transfer Function)Now, to find the gain simply evaluate the Transfer function at j ( ) ( )=1 2+25 =1( )2+25=125 211 Calculating Gain and Phase in Matlab12 Matlabuses Transfer Functions to calculate gain and Phase and generate bode plots Recall that there are 2 ways to plot data logarithmically 1) Plot on a log scale 2) Take the log of the data & plot on normal scale Matlabdoes both (just to be annoying or to ensure you can do both actually its just the standard of how bode plots are shown). Calculating Gain and Phase in Matlab13 Matlab plots the Gain in decibels (db):1 =20 10( ) Note the following about db:G=0 db(Gain=1, output=input)G>0 db(Gain>1, output>input)G<0 db(Gain<1, output<inputCalculating Gain and Phase in Matlab14 Matlab code:>> num=1;>> den=[1 0 25].
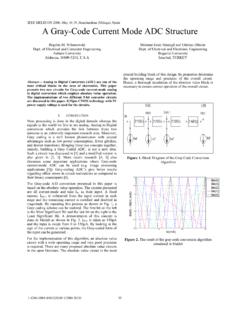
4 % 2+0 +25>> sys=tf(num,den)>>bode(sys) If you want the actual gain you can do:>>[gain, Phase , freq]=bode(sys) Calculating Gain and Phase in Matlab15 Note the spike at =5 rad/sExample #316 PI Cruise Control from a few lectures ago: + = + = Taking the laplaceof each equation (with IC=0 and e=r-v): ( ) + ( ) = ( ) + ( ) = ( )Example #317 Substituting in F(s) and collecting terms + + + = + Then solving for the Transfer function: ( )= + + + + = + 2+( + ) + Example #318 This is called the closed loop Transfer function It is from the reference input to the velocity output Notice the DC Gain is one (which means for a constant reference, the steady state velocity will equal the reference Notice the PI controller adds a zero (root in the numerator) and a pole So the total order is 2ndorder (2 poles or 2ndorder denominator)Example #319 Now to find the gain and Phase : = + 2+( + ) + =( )2+( )2( + )2+( 2)2 = 1 1 + 2 Example #3 (Bode Plot)20m=1800 kg (me in a mustang)b=10 Ns/m (made up)Kp=1,589 Ns/mKi=710 N/mExample #321 Lets assume R=10sin(1t).)
5 What would the car s velocity be? 1=(1589)2+(710)2(1599)2+(710 1800)2= 1= 11589710 11599710 1800= 58 = (1 )