Transcription of CFD Predictions of Bubbly Flow around an Energy-saving ...
1 Mitsubishi Heavy Industries Technical Review Vol. 48 No. 1 (March 2011). 53. CFD Predictions of Bubbly Flow around an Energy-saving Ship with Mitsubishi Air Lubrication System MAKOTO KAWABUCHI*1 CHIHARU KAWAKITA*2. SHUJI MIZOKAMI*3 SEIJIRO HIGASA*3. YOICHIRO KODAN*1 SHINICHI TAKANO*1. The Mitsubishi Air Lubrication System (MALS) was the first air lubrication system in the world to be applied to a newly built ship, and resulted in a substantial reduction in the ship's resistance. Therefore, a performance estimation method using computational fluid dynamics (CFD) needs to be established as soon as possible to apply the MALS to general commercial ships.
2 In this study, we predicted the bubble distribution around ships with the MALS using CFD, and developed a method to determine the reduction in flow resistance based on the bubble coverage around the hull. Furthermore, we also predicted the intrusion of bubbles on the area of propeller disks, which could deteriorate the performance, and confirmed that the deterioration in propeller disk performance was negligible. |1. Introduction The development of Energy-saving ships has been greatly anticipated by the shipping industry as a countermeasure against the surging prices of raw materials, including oil, arising from the economic growth of developing countries, and environmental issues such CO2 emission regulations for international shipping operations.
3 The air lubrication method, which reduces the resistance of the hull by using air bubbles, has been studied by a number of institutes because the method is expected to result in prominent Energy-saving effects. Kodama et performed tests using a flat-plate model ship with a total length of 50 m and confirmed that the total resistance working on the model ship and the local frictional force working on the ship bottom were reduced by bubbles. Verifications on actual ships have also been conducted; Kodama et demonstrated an Energy-saving effect of 5% in an actual ship test using a cement carrier. Research on the use of computational fluid dynamics (CFD) to predict the effect of Bubbly flow has also been promoted.
4 Murakami et simulated the flow around the cement carrier used by Kodama et for experiments, and evaluated the effects of changes in the ship posture and location of the bubble outlets on the resistance reduction ratio for the ship and the void fraction on the propeller disk area. The Nagasaki Shipyard & Machinery Works of Mitsubishi Heavy Industries, Ltd., (MHI) completed YAMATAI, a module carrier belonging to the NYK-Hinode Line, Ltd., in April 2010. An air lubrication system was installed on a ship for the first time on this occasion. The ship achieved an Energy-saving effect of more than 10% at sea trials prior to delivery.
5 While developing the Mitsubishi Air Lubrication System (MALS) installed on YAMATAI, air bubble Predictions utilizing CFD technology were performed in addition to tests on model and actual ship. The tests on a model ship confirmed the flow of bubbles along the bottom of the ship and were used to evaluate the effect of the void fraction on the propeller disk area on the propeller characteristics and fluctuating pressure (Takano et ). We used CFD with the same model-scale ship to predict the distribution of the air bubble void fraction on the hull surface, which is required to predict the reduction of the hull resistance, as well as the distribution of the void fraction on the *1 Nagasaki Research & Development Center, Technical Headquarters *2 Research Manager, Nagasaki Research & Development Center, Technical Headquarters *3 Engineering Manager, Ship & Ocean Engineering Department, Shipbuilding & Ocean Development Headquarters Mitsubishi Heavy Industries Technical Review Vol.
6 48 No. 1 (March 2011). 54. propeller disk area, which affects the propeller performance. The results of these Predictions are reported in this paper. |2. Prediction of the Air Bubble Distribution on the Hull Surface The air bubble distribution around the hull surface is believed to be an important parameter for reducing the resistance working on the hull, and must therefore be predicted accurately. The predicted void fraction distribution due to air bubbles on the hull surface is reported in this chapter. Here, the void fraction is the ratio of the air volume to the air fluid mixture. Ship specifications and flow conditions The ship specifications are shown in Table 1.
7 The ship was a twin-screw vessel characterized by its wide breadth and shallow draft. The calculation results reported here are based on a model ship navigating in a straight line using double model approximation without considering waves on a free surface. The calculations were performed on the port side only based on the line of symmetry along the hull centerline. All of the air bubbles were assumed to be of a uniform diameter and remain unchanged by the flow. No consideration was given to bonding of bubbles or division of a bubble into multiple bubbles. The bubble diameters indicated in Table 2 were used for calculations. The bubble diameter for actual ships was assumed to be 2 to 3 mm.
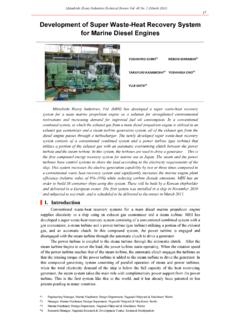
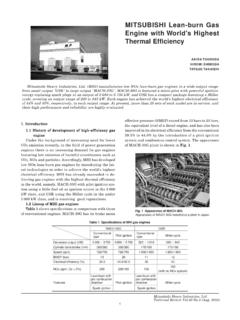
8 The diameters examined in Cases 2 and 3. were set to 5 and 10 times the value of Case 1, respectively, to provide an approximate indication of the effect of the bubble diameter. Bubble outlets were created at three locations along the bottom of the hull, symmetrically on both sides of the centerline, as shown in Figure 1. The bubble outlets were created at two locations, one near the front and the other near the rear, because the calculations were performed on the port side only in this study. A velocity boundary was created at the bubble outlet; the air was blown at a constant flow rate to form the bubbles. Table 1 Specifications of YAMATAI.
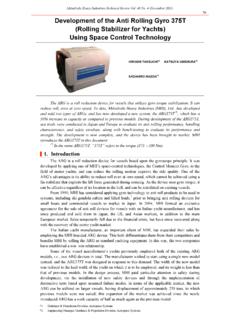
9 YAMATAI. Ship (Module Carrier). Length Loa 162m Breadth B 38m Depth D Draft d / Approximately Deadweight - 19 , 500t Design speed U Model Scale 1 Table 2 Air bubble dimensions Model Ship Actual Ship Figure 1 Image of the air lubrication system (mm) (mm) The bottom of the ship is covered by air bubbles released from the Case 1 bubble outlets. Case 2 Case 3 Comparison of calculations and test results The calculated void fraction distributions from the air bubbles on the hull surface are shown in Figure 2 for Cases 1 to 3. The contours indicate the void fraction distribution. A higher void fraction corresponds to a higher ratio of air per unit volume.
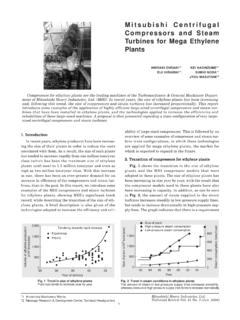
10 The calculations indicated that the influence of the air bubble diameter on the air bubble distribution was limited. Therefore, although actual air bubble diameters can vary, the bubble effect can be roughly predicted from calculations based on bubbles with a particular uniform size. The calculated results using bubbles are compared to the experimental data of Takano et in Figure 3. Both sets of data correspond to an ordinary water level and do not take into consideration hull motion other than a straight, forward movement. A quantitative evaluation of the air bubble distribution was difficult; therefore, the predicted void fraction distributions were qualitatively compared with air bubble distribution images obtained from the experiments.