Transcription of Chapter 2 Simple Linear Regression Analysis The simple ...
1 Regression Analysis | Chapter 2 | Simple Linear Regression Analysis | Shalabh, IIT Kanpur 111 Chapter 2 Simple Linear Regression Analysis The Simple Linear Regression model We consider the modelling between the dependent and one independent variable. When there is only one independent variable in the Linear Regression model, the model is generally termed as a Simple Linear Regression model. When there are more than one independent variables in the model, then the Linear model is termed as the multiple Linear Regression model.
2 The Linear model Consider a Simple Linear Regression model 01yX where y is termed as the dependent or study variable and X is termed as the independent or explanatory variable. The terms 0 and 1 are the parameters of the model. The parameter 0 is termed as an intercept term, and the parameter 1 is termed as the slope parameter. These parameters are usually called as Regression coefficients. The unobservable error component accounts for the failure of data to lie on the straight line and represents the difference between the true and observed realization of y.
3 There can be several reasons for such difference, , the effect of all deleted variables in the model, variables may be qualitative, inherent randomness in the observations etc. We assume that is observed as independent and identically distributed random variable with mean zero and constant variance 2 . Later, we will additionally assume that is normally distributed. The independent variables are viewed as controlled by the experimenter, so it is considered as non-stochastic whereas y is viewed as a random variable with 01()EyX and 2().
4 Var y Sometimes X can also be a random variable. In such a case, instead of the sample mean and sample variance of y, we consider the conditional mean of y given Xx as 01(|)Eyxx Regression Analysis | Chapter 2 | Simple Linear Regression Analysis | Shalabh, IIT Kanpur 222and the conditional variance of y given Xx as 2(|)Var y x . When the values of 201,and are known, the model is completely described. The parameters 01, and 2 are generally unknown in practice and is unobserved.
5 The determination of the statistical model 01yX depends on the determination ( , estimation ) of 01, and 2 . In order to know the values of these parameters, n pairs of observations ( , )( 1,.., ) on ( , )iixyinXy are observed/collected and are used to determine these unknown parameters. Various methods of estimation can be used to determine the estimates of the parameters. Among them, the methods of least squares and maximum likelihood are the popular methods of estimation. Least squares estimation Suppose a sample of n sets of paired observations ( , ) ( 1,2.)
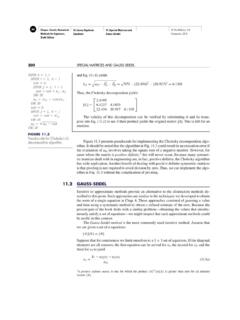
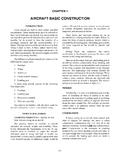
6 , )iixyin is available. These observations are assumed to satisfy the Simple Linear Regression model, and so we can write 01(1,2,..,).iiiyxin The principle of least squares estimates the parameters 01and by minimizing the sum of squares of the difference between the observations and the line in the scatter diagram. Such an idea is viewed from different perspectives. When the vertical difference between the observations and the line in the scatter diagram is considered, and its sum of squares is minimized to obtain the estimates of 01and , the method is known as direct Regression .
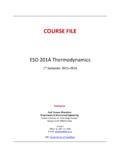
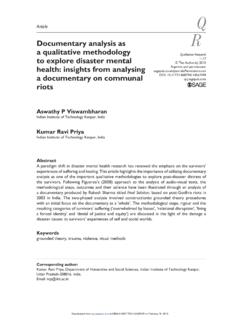
7 01YX (xi, (Xi, yixi Direct Regression Regression Analysis | Chapter 2 | Simple Linear Regression Analysis | Shalabh, IIT Kanpur 333 Alternatively, the sum of squares of the difference between the observations and the line in the horizontal direction in the scatter diagram can be minimized to obtain the estimates of 01and . This is known as a reverse (or inverse) Regression method. Instead of horizontal or vertical errors, if the sum of squares of perpendicular distances between the observations and the line in the scatter diagram is minimized to obtain the estimates of 01and , the method is known as orthogonal Regression or major axis Regression method.))
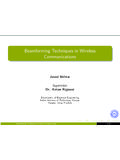
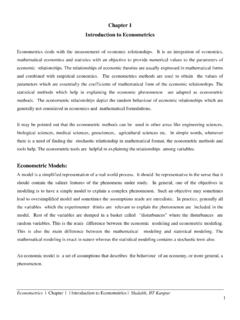
8 (Xi, Yi)(xi, yi)01YX yi xi, Reverse Regression method (xi (Xi )01YX yi xi Major axis Regression method Regression Analysis | Chapter 2 | Simple Linear Regression Analysis | Shalabh, IIT Kanpur 444 Instead of minimizing the distance, the area can also be minimized. The reduced major axis Regression method minimizes the sum of the areas of rectangles defined between the observed data points and the nearest point on the line in the scatter diagram to obtain the estimates of Regression coefficients.)
9 This is shown in the following figure: The method of least absolute deviation Regression considers the sum of the absolute deviation of the observations from the line in the vertical direction in the scatter diagram as in the case of direct Regression to obtain the estimates of 01and . No assumption is required about the form of the probability distribution of i in deriving the least squares estimates. For the purpose of deriving the statistical inferences only, we assume that 'is are random variable with 2() 0, () and (, )0forall (, 1,2.)
10 ,).iiijEVarCovij i jn This assumption is needed to find the mean, variance and other properties of the least-squares estimates. The assumption that 'is are normally distributed is utilized while constructing the tests of hypotheses and confidence intervals of the parameters. Based on these approaches, different estimates of 01and are obtained which have different statistical properties. Among them, the direct Regression approach is more popular. Generally, the direct Regression estimates are referred to as the least-squares estimates or ordinary least squares estimates.