Transcription of Chapter 4 Conjunctive Use of the Brazos River Alluvium Aquifer
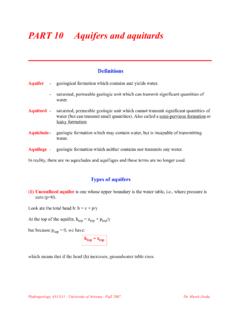
1 61 Chapter 4 Conjunctive Use of the Brazos River Alluvium Aquifer David O Rourke, , Introduction This paper presents some basic hydrogeologic data describing the Brazos River Alluvium Aquifer , culled from various published sources. This paper also presents the results of a groundwater model of a section of the Brazos River Alluvium that was developed to examine the conceptual feasibility of a managed enhanced recharge project. Much of this work was done for the Brazos G Regional Water Planning Group during the preparation of the 2002 State Water Plan. Hydrogeologic Data The Brazos River Alluvium is identified by the Texas Water Development Board (TWDB) as a minor Aquifer in the State of Texas. The Aquifer extends from Whitney Dam in the northwest to Fort Bend County in the southeast (Figure 4-1). The deposits of the Brazos River Alluvium are comprised of Quaternary-aged unconsolidated clay, silt, sand, and gravel deposited by flooding of the Brazos River and Little Brazos River .
2 Older alluvial terrace deposits also occur contiguous with the Alluvium . The thickness of the Brazos River Alluvium exceeds 100 feet in some isolated downstream areas but averages approximately 45 to 50 feet throughout its extent. Within the model area, thickness of the Aquifer is approximately 50 to 60 feet. The Brazos River Alluvium in the model area is underlain by older Cretaceous and Eocene-aged deposits (Figure 4- 2), some of which comprise major or minor aquifers. In general, the piezometric heads in the underlying water-bearing formations are greater than the piezometric head in the Brazos River Alluvium , which indicates an unquantified amount of recharge to the Alluvium from the underlying formations. Groundwater in the Aquifer occurs under water table conditions ( that is, there is no contiguous confining layer located above the Aquifer ). Water table elevations slope toward the Brazos River , indicating that the Brazos is gaining flow supplied by Aquifer discharge.
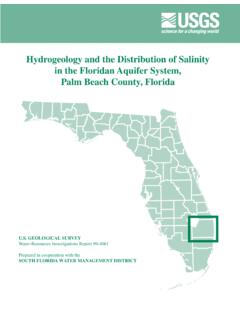
3 It is unclear from published data whether the Little Brazos River is a gaining reach. 1 HDR Engineering, Incorporated 62 Figure 4-1. Brazos River Alluvium and Gulf Coast aquifers. 63 Figure 4-2. Geologic map with Brazos River Alluvium Aquifer . 64 Recharge to the Aquifer occurs primarily through direct precipitation onto the Aquifer surface and subsequent percolation of a portion of this precipitation to the saturated zone of the Alluvium . A minor amount of recharge may be supplied to the Aquifer from upward vertical leakance from the underlying bedrock formations that are crossed by the Alluvium . Discharge from the Aquifer occurs through seepage into the Brazos River , evapotranspiration, and wells. The primary use of groundwater from the Aquifer is for local irrigation. Recent estimates of groundwater use from the Aquifer are approximately 25,000 acre-feet per year. Following is a summary of reported data describing the hydrogeologic properties of the Brazos Alluvium Aquifer from Cronin and Wilson (1967): Reported transmissivity estimates in the Brazos River Alluvium range from 50,000 gallons per day per foot (gpd/ft) to 300,000 gpd/ft.
4 Reported laboratory permeability (hydraulic conductivity) values range from less than 1 foot per day up to 2,400 feet per day, with an average value of about 290 feet per day for 19 samples collected. Reported specific yield estimates range from 4 to 35 percent and average approximately 24 percent. A conservative estimate is probably 15 percent. Well yields from large irrigation supply wells located in thick portions of the Alluvium are typically between 250 and 500 gallons per minute. Water quality varies widely throughout the Aquifer , with total dissolved solids concentrations reported from less than 500 milligrams per liter to greater than 3,000 milligrams per liter ( Figure 4-3). On the basis of reported saturated thickness and a storage value of 15 percent, it is estimated that nearly 3,000,000 acre-feet of water is in storage in the Aquifer . Groundwater Model Development Background During analysis of water management strategies for the 2001 State Water Plan, the feasibility of a conceptual Conjunctive use project utilizing the Brazos River Alluvium was evaluated for Region G.
5 Conjunctive use is proposed to be accomplished through enhanced recharge to the Aquifer for temporary storage during times of adequate precipitation and River flow and subsequent recovery from the Aquifer during times of low precipitation and reduced River flow. It should be noted that this project is conceptual in nature: no actual project is being pursued on the ground at present. As part of the analysis, a groundwater model was developed to evaluate hydrologic conditions associated with operation of the project. The purpose of this model is to assess the potential for Conjunctive use of surface water from the Brazos River and groundwater from the alluvial Aquifer . The model is used to examine the response of the Aquifer system to enhanced recharge, to monitor the movement of this recharge water through the system, to evaluate potential water losses from the system, and to determine an appropriate operational cycle for recharge and recovery (that is, long-term drought-proofing vs.)
6 Fixed seasonal operation 65 Figure 4-3. Groundwater quality in the Brazos River Alluvium Aquifer . 66 schedule). The area of the Aquifer identified for this study is located in Robertson, Milam, Burleson, and Brazos c ounties between the city of Calvert and State Highway 21 (Figure 4-2). Structure The Brazos River Alluvium , which is actually comprised of numerous interfingering layers of sand, silt, clay, and gravel, was represented as a single hydrogeologic layer. The model was restricted to a single layer for simplicity. Reliable data regarding flow between the Alluvium and the underlying Carrizo-Wilcox Aquifer is difficult to obtain and would have introduced an extra calibration variable with no observed data to calibrate to. A finite difference grid consisting of 100 rows and 300 columns was developed and aligned so that model rows were approximately parallel to the Brazos and Little Brazos rivers. Grid cells were sized to be 500 feet square in order to capture groundwater movement at a local scale.
7 The model grid area is displayed on Figure 4-4. Figure 4-4. Groundwater model area with hydraulic conductivity zones Digital elevation data from the . Geological Survey were used to determine land surface elevations, and the data was imported using ArcView GIS software to populate the model grid cells with appropriate values. Structure maps from Cronin and Wilson (1967) were used to determine the elevation of the base of the Alluvium . Ten-foot contours of this data were digitized and imported into the model using Ground Water Vistas, and an internal kriging procedure was utilized to populate all model gird cells with appropriate values. Boundary Conditions The following section describes boundary conditions adopted for the groundwater model development: No-flow boundaries were imposed in all non- Alluvium cells. A constant head boundary of 300 feet was defined at the northern upgradient edge of the model (near Calvert).
8 67 The MODFLOW General Head Boundary (GHB) package was used to simulate the southeastern downgradient edge of the model (near Highway 21) with an assigned head of approximately 205 feet above mean sea level. The Brazos River and the Little Brazos River were represented using MODFLOW s River Package. A free water surface two feet higher than the stream bed surface elevation was assigned in both rivers. MODFLOW s Drain Package was used to simulate small ephemeral creeks on the Alluvium surface that might be supplied by discharge from the Alluvium under high water table conditions. MODFLOW s Well Package was used to simulate existing irrigation wells within the model area as well as the enhanced recharge and recovery operations. MODFLOW s Recharge package was used to simulate direct recharge to the Aquifer surface from precipitation. An initial estimate of eight percent of precipitation based on Cronin and Wilson (1967) was reduced to four percent of precipitation during model calibration.
9 Evapotranspiration was simulated using MODFLOW s ET Package. Aquifer Parameters Hydraulic conductivity was represented using five different zones, varying from 100 to 200 feet per day, based on examination of well test data available in Cronin and Wilson (1967) ( Figure 4-4). A storage coefficient (specific yield) of was used for the model. This is a typical storage coefficient used to represent water table conditions and is corroborated by Cronin and Wilson (1967). Well pumpage values for the irrigation supply wells in the model were generated by evaluating Aquifer use totals by county and then applying a typical irrigation use pattern with adjustments made for unusual precipitation conditions. A basic monthly water use distribution for the Brazos River Basin was modified to take into account rainfall totals during the calibration period. In months where the actual rainfall received was significantly less than the average rainfall for that month, the pumpage distribution factor for that month was increased to allow for greater pumpage.
10 Conversely, in months where the actual rainfall received was significantly greater than the average rainfall for that month, the pumpage distribution factor for that month was decreased. As mentioned previously, recharge was initially assigned a value of eight percent of precipitation measured at the College Station rain gage. This value was adjusted downward to four percent of precipitation during calibration. Evapotranspiration rates used for the model area were derived from the Priestly-Taylor method, and an annual time series of twelve monthly values was applied to the model for the runs. Evaporation rates varied from approximately 10-3 feet per day ( millimeters per day) to 10-2 feet per day (8 millimeters per day). The extinction depth was set at 15 feet. 68 The River package in MODFLOW simulates hydrologic interaction between rivers and the surrounding Aquifer . Flow to and from the rivers is based on head differences between the River stage and the groundwater level in the model cell containing the River .