Transcription of Chapter 3 Population and Water Demand Projections
1 128 Chapter 3: Population an d Water Deman d ProjectionsWAT E R FOR TEXAS 2012 STATE Water PLANQ uick FactsEven with significant Population increase, Water Demand in Texas is projected to increase by only 22 percent, from about 18 million acre feet per year in 2010 to about 22 million acre feet per year in 2060. This smaller increase is primarily due to declining Demand for irrigation Water and increased emphasis on municipal E R FOR TEXAS 2012 STATE Water PLAN129 Chapter 3: Population an d Water Deman d ProjectionsThe first step in the regional Water planning process is to quantify current and projected Population and Water Demand over the 50-year planning horizon. Both the state and regional Water plans incorporate projected Population and Water Demand for cities, Water utilities, and rural areas throughout the state. Water Demand Projections for wholesale Water providers and for manufacturing, mining, steam-electric, livestock, and irrigation Water use categories are also used in the planning process.
2 TWDB developed Projections in coordination with the Texas Commission on Environmental Quality, Texas Parks and Wildlife Department, Texas Department of Agriculture, and the regional Water planning groups for inclusion in the regional Water plans and the state 3 Population and Water Demand ProjectionsThe Population in Texas is expected to increase 82 percent between the years 2010 and 2060, growing from million to million people. Growth rates vary considerably across the state, with some planning areas more than doubling over the planning horizon and others growing only slightly or not at plan. The final Population and Water Demand Projections are approved by TWDB s governing Population PROJECTIONSAs noted in every state Water plan since the 1968 State Water Plan, Texas is a fast-growing state, and every new Texan requires Water to use in the house, on the landscape, and in the food they consume and materials they is not only the second most populated state in the nation, but also the state that grew the most between 2000 and 2010, increasing from million residents to million (Figure ).
3 However, such dramatic growth has not occurred evenly across the 130 Chapter 3: Population an d Water Deman d ProjectionsWAT E R FOR TEXAS 2012 STATE Water PLAN state. Of 254 counties, 175 gained Population and 79 lost Population between the 2000 and 2010 censuses. The majority of the growing counties were located in the eastern portion of the state or along the Interstate Highway-35 PROJECTION METHODOLOGYAs required in the Water planning process, the Population of counties, cities, and large non-city Water utilities were projected for 50 years, from 2010 to 2060. During the development of the 2011 regional Water plans, due to the lack of new census data, the Population Projections from the 2007 State Water Plan were used as a baseline and adjusted where more recent data was available from the Texas State Data Population Projections for the 2006 regional Water plans and the 2007 State Water Plan were created by a two-step process.
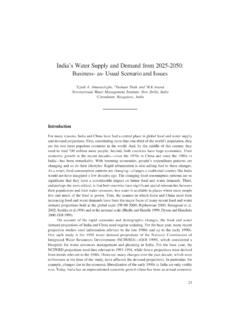
4 The initial step used county Projections from the Office of the State ,145,56129,650,38833,712,02037,734,42241 ,924,16746,323,72505,000,00010,000,00015 ,000,00020,000,00025,000,00030,000,00035 ,000,00040,000,00045,000,00050,000,00020 10*20202030204020502060*2010 Population is the official Population count from the Census Bureau; 2020 2060 represent projected Population used in the 2012 State Water TEXAS STATE Population PROJECTED TO and the Texas State Data Center, the agencies charged with disseminating demographic and related socioeconomic data to the state of Texas. These Projections were calculated using the cohort-component method: the county s Population is projected one year at a time by applying historical growth rates, survival rates, and net migration rates to individual cohorts (age, sex, race, and ethnic groups). The Texas State Data Center Projections are only done at the county level, requiring further analysis to develop Projections for the sub-county areas.
5 Sub-county Population Projections were calculated for cities with a Population greater than 500, non-city Water utilities with an average daily use greater than 250,000 gallons, and county-other. County-other is an aggregation of residential, commercial, and institutional Water users in cities with less than 500 people or non-city utilities that provide less than an average of 250,000 gallons per day, as well as WAT E R FOR TEXAS 2012 STATE Water PLAN131 Chapter 3: Population an d Water Deman d Projectionsunincorporated rural areas in a given county. With the county Projections as a guide, Projections for the municipal Water user groups (cities and utilities) within each county were calculated. In general, the Projections for these Water user groups were based upon the individual city or utility s share of the county growth between 1990 and 2000. TWDB staff developed draft Population Projections with input from staff of the Texas Commission on Environmental Quality, Texas Parks and Wildlife Department, and Texas Department of Agriculture.
6 Following consultations with the regional Water planning groups, these Projections were then adopted by TWDB s governing board for use in the 2006 regional Water the 2011 regional Water plans, the planning groups were able to request revisions to Population Projections for specific municipal Water user groups, including cities and large non-city utilities. In certain FIGURE PROJECTED Population GROWTH FOR PLANNING REGIONS FOR 2010 , Population estimates suggested that growth was taking place faster in some of the counties and cities than what was previously projected in the 2006 regional Water plans. The planning groups could propose revisions, with the amount of upward Population projection revision roughly limited to the amount of under- Projections , as suggested by the Texas State Data Center s most recent Population estimates. Population Projections were revised, at least partially, for all changes requested by the planning groups: 352 municipal Water user groups in 64 counties and 9 regions.
7 This input from the cities and utilities through the regional Water planning groups, combined with the long-range, demographically-driven methods, increases the accuracy of the Population Projections . The statewide total of the Projections for 2010 that resulted from this process were slightly higher than the 2010 Census < 1%82%0%20%40%60%80%100%120%140%160%132 Chapter 3: Population an d Water Deman d ProjectionsWAT E R FOR TEXAS 2012 STATE Water PROJECTIONSDue to natural increase and a net in-migration, it is projected that Texas will continue to have robust growth. The state is projected to grow approximately 82 percent, from million in 2010 to million, by 2060 (Figure ). As illustrated in the growth over the last decade, regional Water planning areas that include the major metropolitan areas of Houston (Region H), the Dallas-Fort Worth area (C), Austin (K), San Antonio (L), and the Lower Rio Grande Valley (M) are anticipated to capture 82 percent of the state s growth by 2060 (Table ).
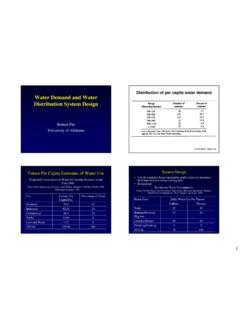
8 Regions C, G, H, L, and M are expected to grow the most by 2060, while regions B, F, and P are expected to grow at the lowest rates. Individual counties are expected to grow at varying rates (Figure ). ACCURACY OF PROJECTIONSAt the state level, the 2010 Population Projections for the 2011 regional Water plans were 1 percent greater than the 2010 census results: million versus million residents (Figure ). Comparisons of Region201020202030204020502060A388,10442 3,380453,354484,954516,729541,035B210,64 2218,918223,251224,165223,215221,734C6,6 70,4937,971,7289,171,65010,399,03811,645 ,68613,045,592D772,163843,027908,748978, 2981,073,5701,213,095E863,1901,032,9701, 175,7431,298,4361,420,8771,542,824F618,8 89656,480682,132700,806714,045724,094G1, 957,7672,278,2432,576,7832,873,3823,164, 7763,448,879H6,020,0786,995,4427,986,480 8,998,00210,132,23711,346,082I1,090,3821 ,166,0571,232,1381,294,9761,377,7601,482 ,448J135,723158,645178,342190,551198,594 205,910K1,412,8341,714,2822,008,1422,295 ,6272,580,5332,831,937L2,460,5992,892,93 33,292,9703,644,6613,984,2584,297,786M1, 628,2782,030,9942,470,8142,936,7483,433, 1883,935,223N617,143693,940758,427810,65 0853,964885,665O492,627521,930540,908552 ,188553,691551,758P49,49151,41952,13851, 94051,04449,663 Texas25,388,40329,650,38833,712,02037,73 4,42241,924,16746,323.
9 > 10050 to 10025 to 500 to 25< 0 Population growth rate 2010 to 2060(percent change)TABLE TEXAS STATE Population Projections FOR 2010 20602010 Projections and the 2010 census for the previous seven state Water plans range from an over-projection of percent in the 1968 State Water Plan to an under-projection by percent in the Low series of the 1984 State Water Plan. The prior two state Water plans developed through regional Water planning, the 2002 State Water Plan and the 2007 State Water Plan, under-projected the 2010 Population by only and percent, respectively. The 2060 Population projection is projected to be slightly higher than what was projected in the 2007 State Water Plan: million compared to million. While shorter-range Projections will always tend to be more accurate, the regional Water planning process increases overall projection accuracy because of the use of better local geographic areas with smaller populations (regions, counties, and Water user groups), the relative difference between projected Population and actual growth can increase.
10 At the regional Water planning area level, 12 regions had populations that were over-projected, most notably Region N at percent, Region J at percent, and Region B at percent Region2000 Census2010 Census2010 Projected Population , 2012 SWPP rojection DifferenceA355,832380,733388, ,970199,307210, ,254,7486,455,1676,670, ,171762,423772, ,399826,897863, ,814623,354618, ,621,9651,975,1741,957, ,848,9186,093,9206,020, ,011,3171,071,5821,090, ,742127,898135, ,132,2281,411,0971,412, ,042,2212,526,3742,460, ,236,2461,587,9711,628, ,184564,604617, ,997489,926492, ,06849,13449, al20,851,82025,145,56125,388, E R FOR TEXAS 2012 STATE Water PLAN133 Chapter 3: Population an d Water Deman d PROJECTIONSDue to natural increase and a net in-migration, it is projected that Texas will continue to have robust growth. The state is projected to grow approximately 82 percent, from million in 2010 to million, by 2060 (Figure ).