Transcription of Chapter 7: SAMPLING DISTRIBUTIONS & POINT …
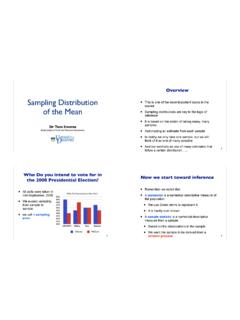
1 Chapter 7 SAMPLING DISTRIBUTIONS and POINT Estimation ofParametersPart 1: SAMPLING DISTRIBUTIONS ,the Central Limit Theorem, POINT Estimation & EstimatorsSections 7-1 to 7-21 / 26 Statistical InferencesA random sampleis collected on a populationto draw conclusions, ormake statistical inferences, about the (Random Sample)The random variablesX1,X2,..,Xnare arandom sampleof ) theXi s are independent2) everyXhas the same probability distributionTypes of statistical inference:1 Parameter estimation( estimating ) with a confidence intervalFor estimating , we collect data and we use the observed samplemean xas a POINT estimatefor and create a confidence interval toreport a likely range in which testingabout a population parameter ( : = 50)We wish to compare the mean time that women and men spend at : M= W?
2 Or perhaps there is evidence against / 26 Sample Mean X, a POINT Estimate for The sample mean Xis used as a POINT estimate for the populationparameter . It is a POINT estimate because it is a single : = X(a hat over a parameter represents an estimator) Xis the estimator herePrior to data collection, Xis random variableand it is the statisticof interest calculated from the data when estimating .The value we get for X(the sample mean) depends on the specificsample chosen!If Xis random variable, then it has a certain expected value,variance, and distribution. The distribution of the random variable Xis called the SAMPLING distribution of / 26 Sample-to-Sample VariabilityAs stated earlier, there is randomness in the Xvalue we get from arandom sample.
3 Suppose I want to estimate a population meanheight using a sample mean I randomly select 50 individuals from a population, measuretheir heights, and find the sample mean x=5 foot 6 inchesSuppose I repeat the process, I again randomly select 50 individualsfrom a population, measure their heights, and find the sample mean x=5 foot 8 inchesSuppose I repeat the process, I again randomly select 50 individualsfrom a population, measure their heights, and find the sample mean x=5 foot 5 inchesI didn t do anything wrong in my data collection, this is justSAMPLING VARIABILITY![NOTE: In reality, we only take one sample. The above is meant to emphasize theexistence of sample-to-sample variability.]4 / 26 The SAMPLING Distribution of XDefinition ( SAMPLING Distribution)The probability distribution of a statistic is called asampling distribution.
4 Xis a statistic calculated from a random sampleX1,X2,..,Xn. Xis a linear combination of random variables. X= ni=1 Xin=1nX1+1nX2+ +1nXnFor a random sampleX1,X2,..,Xndrawn from any distributionwithE(Xi) = andV(Xi) = 2orXi ?( , 2), we haveE( X) = andV( X) = 2nBut a mean and variance does not fully specify a we know the probability distribution of X? ..5 / 26 The SAMPLING Distribution of XIt turns out that Xhas some predictable theX1,X2,..,Xnaredrawn from a normaldistribution, or bynotationXi N( , 2)for alli, then X N( , 2n)for any sample IQ scores are normally distributed with mean = 100andvariance 2= 256. Ifn= 9IQ scores are drawn at random from thispopulation, what is the probability that the sample mean is less than 93?ANSWER:FindP( X <93)(next page).
5 6 / 26 The SAMPLING Distribution of XExampleSuppose IQ scores are normally distributed with mean = 100andvariance 2= 256. Ifn= 9IQ scores are drawn at random from thispopulation, what is the probability that the sample mean is less than 98?ANSWER:FindP( X <93).We first need a distribution for X(it follows a normal distribution!), andthen we ll use it to create aZrandom variable and use / 26 The SAMPLING Distribution of XThe graphic below shows how the variability in Xdecreases asnincreases. Recall X N( , 2n).8 / 26 The SAMPLING Distribution of XNotation:E( X) = X=E(X) = V( X) = 2 X=V(X)n= 2nTerminology:The termstandard deviationrefers to the population standarddeviation, or V(X) = , The termstandard erroris a value related to Xand is also morefully stated as thestandard error of the sample meanand it is thesquare root of the variance of Error of Xis V( X) = 2n= nAnd X 2n= X / n9 / 26 The SAMPLING Distribution of XEven whenXiare NOT drawn from a normal distribution, it turnsout that Xhas some predictable theX1,X2.
6 ,XnwereNOT drawn from a normaldistribution,or by notationXi ?( , 2)for alli, then Xis approximatelynormally distributed as long asnis large enough or X N( , 2n)forn >25 or , Xfollows a normal distribution!!! (for a sufficiently largen)This is an incredibly useful result for calculating probabilities for X!!10 / 26 The SAMPLING Distribution of XExample (Probability for X, Flaws in a copper wire)LetXdenote the number of flaws in a 1 inch length of copper wire. Theprobability mass function ofXis presented in the following table:xP(X=x) 100wires are sampled from this population. What is theprobability that the average number of flaws per wire in the sample is lessthan ( findP( X < ).. next page)11 / 26 The SAMPLING Distribution of XExample (Probability for X, Flaws in a copper wire)ANSWER:P( X < ))=12 / 26 Central Limit Theorem (CLT)Definition (Central Limit Theorem)LetX1,X2.
7 ,Xnbe a random sample drawn from any population (ordistribution) with mean and variance 2. If the sample size is*sufficiently large*, then Xfollows an approximate normal write: Xd N( , 2n)asn Or:Z= X / nd N(0,1)asn If the random sample is drawn from a non-normal population, then Xisapproximately normal for sufficient largen(at least 25 or 30) and theapproximation gets better and better : If the original parent population from which the sample was drawn isnormal, then Xfollows a normal distribution for anyn(a linear combination ofnormals is normal), and the CLT is not needed to achieve / 26 The SAMPLING Distribution of X(simulation)Let s simulate this 1: Original population is normally distributedxf(x)1 Choose a sample of sizenfrom a normal distribution2 Compute x3 Plot the xon our frequency histogram4Do steps 1-3 many time, such as 1000 times5 Draw a histogram of the 1000 xvalues(to see the SAMPLING distribution of X)See applet at: / 26 The SAMPLING Distribution of X(simulation)Case 1: Original population is normally distributed (withn=2)The empirical distribution for Xn=2is in the lower plot (in blue).
8 Its meanis very close to the parent population mean = 16, and isvery close to the theoretical x= n=5 2= / 26 The SAMPLING Distribution of X(simulation)Case 1: Original population is normally distributed (withn=25)The empirical distribution for Xn=25is in the lower plot (in blue). Itsmean is very close to the parent population mean = 16, and is the same as the theoretical x= n=5 25= / 26 The SAMPLING Distribution of X(simulation)xf(x)RESULT -If the parent population(the one you are drawing from)is normal, then Xwill follow a normal distribution for any samplesizenwith known mean and variance as show below. X N( , 2n)17 / 26 The SAMPLING Distribution of X(simulation)Let s simulate this 2: Original population is NOT normally (x)xf(x)xf(x)1 Choose a sample of sizenfrom a NON-normal distribution2 Compute x3 Plot the xon our frequency histogram4Do steps 1-3 many time, such as 1000 times5 Draw a histogram of the 1000 xvalues(to see the SAMPLING distribution of X)See applet at: / 26 The SAMPLING Distribution of X(simulation)Case 2: Original population is NOT normally distributed(with right-skewed parent population andn=10)The empirical distribution for Xn=10is in the lower plot (in blue).
9 Itsbell-shaped with a mean equal to the parent population mean = is very close to the theoretical x= n= 10= / 26 The SAMPLING Distribution of X(simulation)Case 2: Original population is NOT normally distributed(with very non-normal parent population andn=2)FAIL!!!! The empirical distribution for Xn=2is in the lower plot (in blue)and it is not normally distributed. This is just too small of a sample size toovercome the very non-normal parent / 26 The SAMPLING Distribution of X(simulation)Case 2: Original population is NOT normally distributed(with very non-normal parent population andn=25)The empirical distribution for Xn=25is in the lower plot (in blue). Its bell-shapedwith a mean close to the parent population mean = isvery close to the theoretical x= n= 25= / 26 The SAMPLING Distribution of X(simulation)xf(x)xf(x)xf(x)RESULT -If the parent population(the one you are drawing from)is NOT normal, then Xwill follow an approximate normaldistribution for sufficiently largen(we ll sayn >25 or 30).
10 X N( , 2n)This is the Central Limit approximation improves / 26 The SAMPLING Distribution of XA couple comments:Averages are less variable than individual distribution for Xhasless variabilitythan the distribution distribution of our estimator Xnis squeezed closer to, or istighter, around the thing we re trying to estimate some non-normal DISTRIBUTIONS , the approximation is pretty goodfornlower than 25 or 30, so it depends on the parent populationfrom which we are / 26 The SAMPLING Distribution of XThe next graphic shows 3 different original populations (one nearlynormal, two that are not), and the SAMPLING distribution for Xbasedon a sample of sizen= 5and sizen= three original DISTRIBUTIONS are on the far left (one that is nearlysymmetric and bell-shaped, one that is right skewed, and one that ishighly right skewed).