Example: quiz answers
4.2 Shapes of Distributions - University of Iowa
Figure 4.7 (a) Skewed to the left (left-skewed): The mean and median are less than the mode. (b) Skewed to the right (right-skewed): The mean and median are greater than the mode. (c) Symmetric distribution: The mean, median, and mode are the same. 7 Right-skewed 5.0 5.5 6.0 6.5 7.0 80 70 60 50 40 30 20 10 0 pH F r e q u e n c y pH of Pork Loins. 8
Tags:
Information
Domain:
Source:
Link to this page:
Documents from same domain

The MIXED Procedure - University of Iowa
homepage.stat.uiowa.eduThe MIXED procedure fits a variety of mixed linear models to data and enables you to use these fitted models to make statistical inferences about the data. A mixed linear model is a generalization of the standard linear model used in the GLM procedure, the generalization being that the data are permitted to exhibit correlation and nonconstant

Chapter 5: JOINT PROBABILITY DISTRIBUTIONS …
homepage.stat.uiowa.eduIf Xand Yare discrete, this distribution can be described with a joint probability mass function. If Xand Yare continuous, this distribution can
Chapter 7: SAMPLING DISTRIBUTIONS & POINT …
homepage.stat.uiowa.eduExample of parameter estimation (or point estimation): We’re interested in the value of . We collected data and we use the observed x as a point estimate for .
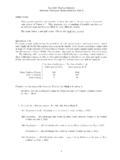
Stat 1030 Business Statistics Additional Final Exam …
homepage.stat.uiowa.eduStat 1030 Business Statistics Additional Final Exam Review Questions (Part I) DIRECTIONS: These practice questions are intended to show the style of the nal exam …

2.1 Data: Types of Data and Levels of Measurement
homepage.stat.uiowa.eduTypes of Data and Levels of Measurement . 2 Quantitative or Qualitative? ! ... Levels of Measurement for Qualitative Data! Qualitative (two levels of qualitative data) " Nominal level (by name) ! ... If a measured value is close to the truth, it has accuracy.
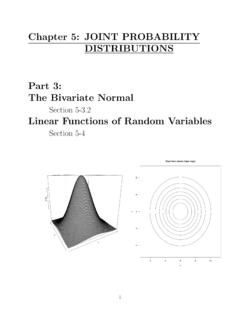
Chapter 5: JOINT PROBABILITY DISTRIBUTIONS Part 3: The ...
homepage.stat.uiowa.eduChapter 5: JOINT PROBABILITY DISTRIBUTIONS Part 3: The Bivariate Normal Section 5-3.2 Linear Functions of Random Variables ... 3 Bivariate Normal When X and Y are independent, the con- ... What is the probability that the load ex-

APA references tutorial with bibTEX
homepage.stat.uiowa.eduother hand, if you want to know about receiver operating characteristic (ROC) curves, a good source of information is Metz (1978). Parenthetical citations are used when you want to cite a reference as a kind of remark at the end of a sentence or phrase. Use \citep for those. If you have two or more parenthetical citations, specify them
Chapter 5: JOINT PROBABILITY DISTRIBUTIONS Part 1 ...
homepage.stat.uiowa.eduChapter 5: JOINT PROBABILITY DISTRIBUTIONS Part 1: Sections 5.1 & 5.2 For both discreteand continuousrandom variables we will discuss the following... Joint Distributions (for two or more r:v:’s) Marginal Distributions (computed from a joint distribution) Conditional Distributions (e.g. P(Y = yjX= x)) Independence for r:v:’s Xand Y
APA references tutorial with bibTEX - University of Iowa
homepage.stat.uiowa.eduAPA references tutorial with bibTEX Russ Lenth November 30, 2011 Prepare your bibliographic database(s) The following clip shows some examples that will be used later in illustrations. These are saved in a file named myrefs.bib. myrefs.bib @Article{Met78, Author = "Metz, Charles E.", Title = "Basic principles of {ROC} analysis",
2.1 Data: Types of Data and Levels of Measurement
homepage.stat.uiowa.eduGold/Silver/Bronze " Summarized with a table or chart. With some reformatting of the earlier data, we can get a count of medals for each year. Number of medals in a year count 0 100 200 300 400 A distribution. The x-axis shows part of the real-number line. Year Count 1896 20 1900 55 1904 394 1908 63 1912 101 1920 193
Related documents
Lecture.4 Measures of averages - Mean – median – mode ...
www.eagri.orgAmong them mean, median and mode are called simple averages and the other two averages geometric mean and harmonic mean are called special averages. Arithmetic mean or mean Arithmetic mean or simply the mean of a variable is defined as the sum of the observations divided by the number of observations. ...
Lecture 2 – Grouped Data Calculation
people.umass.eduMean, Median and Mode 2. First Quantile, third Quantile ... •Mode is the value that has the highest frequency in a data set. •For grouped data, class mode (or, modal class) is the class with the highest frequency. •To find mode for grouped data, use the following formula: ...

Lesson 13: Mean, Median, Mode, and Range
www.literacymn.orgMean, median, and mode are used when comparing statistics in many areas in our society. Ask students what areas these statistics are used in. They should have lots of ideas after doing the workbook problems. Some are school, sports, weather, business, housing sales, and work
Hardin Middle School Math Cheat Sheets
www.jwilliamsmath.weebly.comThe Mean, Median, Mode, and Range When finding the measures of central tendency the first step is to place the numbers in order from least to greatest. Mean (Average): Add up a list of values in a set of data and divide by the number of values you have. 6, 4, 4, 3, 8 Step 1 Put in order from least to greatest 3, 4, 4, 6, 8

Effects of Outliers
www.cusd80.com1 Effects of Outliers • The mean is a good measure to use to describe data that are close in value. • The median more accurately describes data with an outlier. • The mode is a good measure to use when you have categorical data; for example, if each student records his or her favorite
Mean, Median, Mode, Range
scienceres-edcp-educ.sites.olt.ubc.caWhen solving mean, median, mode and range questions, it is often very helpful to rewrite the data from smallest to largest. 13, 13, 13, 15, 16, 16, 16 3 scores data into groups. 3 Median scores Both the median and mode become easy to pick out after arranging the 20, 20, 20, 40, 40, 70, 80 3 2 1 1 Mode = 20 The range can be found by

Mean, mode, median, range worksheet - Skillsworkshop
www.skillsworkshop.orgData Handling – Mean, Mode, Median and Range practice ♦ HD1/L1.3, HD1/L1.4, HD1/L2.3, HD1/L2.4. TO FIND THE MEAN ADD UP ALL OF THE NUMBERS AND DIVIDE BY HOW MANY NUMBERS THERE ARE.
INTRODUCING THE Teaching Tolerance Anti-bias Framework
www.learningforjustice.orgbeing mean or making other people feel bad. Identity 5 ID.K-2.5 I see that the way my family and I do things is both the same as and different from how other people do things, and I am interested in both. Diversity 6 DI.K-2.6 I like being around people who are like me and different from me, and I can be friendly to everyone.