Example: tourism industry
APA references tutorial with bibTEX
other hand, if you want to know about receiver operating characteristic (ROC) curves, a good source of information is Metz (1978). Parenthetical citations are used when you want to cite a reference as a kind of remark at the end of a sentence or phrase. Use \citep for those. If you have two or more parenthetical citations, specify them
Tags:
Information
Domain:
Source:
Link to this page:
Documents from same domain

Chapter 5: JOINT PROBABILITY DISTRIBUTIONS …
homepage.stat.uiowa.eduIf Xand Yare discrete, this distribution can be described with a joint probability mass function. If Xand Yare continuous, this distribution can
Chapter 7: SAMPLING DISTRIBUTIONS & POINT …
homepage.stat.uiowa.eduExample of parameter estimation (or point estimation): We’re interested in the value of . We collected data and we use the observed x as a point estimate for .
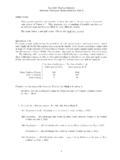
Stat 1030 Business Statistics Additional Final Exam …
homepage.stat.uiowa.eduStat 1030 Business Statistics Additional Final Exam Review Questions (Part I) DIRECTIONS: These practice questions are intended to show the style of the nal exam …

2.1 Data: Types of Data and Levels of Measurement
homepage.stat.uiowa.eduTypes of Data and Levels of Measurement . 2 Quantitative or Qualitative? ! ... Levels of Measurement for Qualitative Data! Qualitative (two levels of qualitative data) " Nominal level (by name) ! ... If a measured value is close to the truth, it has accuracy.
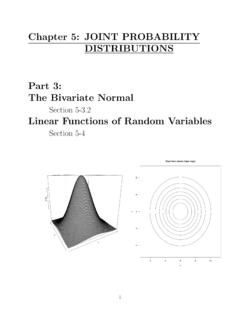
Chapter 5: JOINT PROBABILITY DISTRIBUTIONS Part 3: The ...
homepage.stat.uiowa.eduChapter 5: JOINT PROBABILITY DISTRIBUTIONS Part 3: The Bivariate Normal Section 5-3.2 Linear Functions of Random Variables ... 3 Bivariate Normal When X and Y are independent, the con- ... What is the probability that the load ex-

The MIXED Procedure - University of Iowa
homepage.stat.uiowa.eduThe MIXED procedure fits a variety of mixed linear models to data and enables you to use these fitted models to make statistical inferences about the data. A mixed linear model is a generalization of the standard linear model used in the GLM procedure, the generalization being that the data are permitted to exhibit correlation and nonconstant

4.2 Shapes of Distributions - University of Iowa
homepage.stat.uiowa.eduFigure 4.7 (a) Skewed to the left (left-skewed): The mean and median are less than the mode. (b) Skewed to the right (right-skewed): The mean and median are greater than the mode. (c) Symmetric distribution: The mean, median, and mode are the same. 7 Right-skewed 5.0 5.5 6.0 6.5 7.0 80 70 60 50 40 30 20 10 0 pH F r e q u e n c y pH of Pork Loins. 8
Chapter 5: JOINT PROBABILITY DISTRIBUTIONS Part 1 ...
homepage.stat.uiowa.eduChapter 5: JOINT PROBABILITY DISTRIBUTIONS Part 1: Sections 5.1 & 5.2 For both discreteand continuousrandom variables we will discuss the following... Joint Distributions (for two or more r:v:’s) Marginal Distributions (computed from a joint distribution) Conditional Distributions (e.g. P(Y = yjX= x)) Independence for r:v:’s Xand Y

APA references tutorial with bibTEX - University of Iowa
homepage.stat.uiowa.eduAPA references tutorial with bibTEX Russ Lenth November 30, 2011 Prepare your bibliographic database(s) The following clip shows some examples that will be used later in illustrations. These are saved in a file named myrefs.bib. myrefs.bib @Article{Met78, Author = "Metz, Charles E.", Title = "Basic principles of {ROC} analysis",
2.1 Data: Types of Data and Levels of Measurement
homepage.stat.uiowa.eduGold/Silver/Bronze " Summarized with a table or chart. With some reformatting of the earlier data, we can get a count of medals for each year. Number of medals in a year count 0 100 200 300 400 A distribution. The x-axis shows part of the real-number line. Year Count 1896 20 1900 55 1904 394 1908 63 1912 101 1920 193
Related documents

Comparing Two ROC Curves – Paired Design
ncss-wpengine.netdna-ssl.comThe One ROC Curve and Cutoff Analysis chapter also contains details about finding the optimal cutoff value, as well as hypothesis tests and confidence intervals for individual areas under the ROC curve. ROC Curves A receiver operating characteristic (ROC) curve plots the true positive rate (sensitivity) against the false positive

Lecture 6 Features and Image Matching
courses.cs.washington.eduReceiver Operating Characteristic (ROC) curve ... Actual Matches ROC curve. ... TPR Area ≈1.0 FPR Adapted from a slide by Shin Kira. 0.7 Using ROC curves 0 1 1 false positive rate true positive rate 0.1 • Useful for comparing different feature matching methods • Pick method that maximizes area under the curve

Mid-Upper Arm Circumference (MUAC) Cut-Offs to …
lupinepublishers.comJul 17, 2020 · the MUAC was determined using Receiver Operating Characteristics (ROC) curve analysis. For the ROC curve analysis, validity of MUAC was evaluated against BMI as the reference. To achieve this, ROC curves of MUAC values were plotted at different BMI cut off points. For each graph, the Area Under the Curve (AUC) was used

Bayesian Decision Theory - gatech.edu
www.cc.gatech.eduReceiver Operating Characteristic (ROC) Curve • Every classifier employs some kind of a threshold. • Changing the threshold affects the performance of the system. • ROC curves can help us evaluate system performance for differentthresholds. θω ω a = PP()/() 21 212 22 121 11 ()( ) b ()( ) P P ωλ λ θ ωλ λ − = −
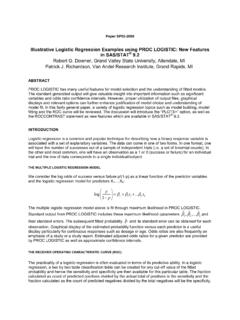
Illustrative Logistic Regression Examples using PROC ...
lexjansen.comsensitivity). These pairs constitute the Receiver Operating Characteristic (ROC) curve. Points far above the 45 degree line are desirable and one hopes to have this curve rise as quickly as possible from the origin. The 45 degree line in the unit square would correspond to an area under the curve (AUC) of 0.5

One ROC Curve and Cutoff Analysis - NCSS
ncss-wpengine.netdna-ssl.comOne ROC Curve and Cutoff Analysis Introduction This procedure generates empirical (nonparametric) and Binormal ROC curves. It also gives the area under the ROC curve (AUC), the corresponding confidence interval of AUC, and a statistical test to determine if AUC is greater than a specified value.

The LOGISTIC Procedure - SAS
support.sas.com4486 F Chapter 58: The LOGISTIC Procedure For nominal response logistic models, where the kC1possible responses have no natural ordering, the logit model can also be extended to a multinomial model known as a generalized or baseline-category logit model,