Transcription of CHM 335 Experiment #1 The Absorption Spectra of …
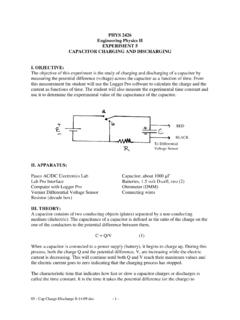
1 CHM 335 Experiment #1 The Absorption Spectra of Conjugated DyesTA: Jeff CanariaOffice: Beaupre 430A Office Hours: Tuesday, 10:00 AMe-mail: The dyes used in this Experiment are toxic Gloves must be worn at all times when handling the dyes Dilutions should be performed in the fume hood. The dyes must remain in the fume hood unless they are actively being read by the spectrophotometer. Wash your hands when you are finished!2 During this Experiment , you will be expected to:1. Find the maximum absorbance wavelength ( max) of each conjugated Calculate the theoretical maximum based on the free-electron model and compare this result to your experimental Write a laboratory report following the specified wavelengths are associated with different colorsWavelength Absorbed(nm)Color absorbedColor seen400-435 VioletYellow-green435-480 BlueYellow480-490 Green-blueOrange490-500 Blue -greenRed500-560 GreenPurple560-580 Yellow-greenViolet580-595 YellowBlue595-605 OrangeGreen-blue605-700 RedBlue-greenBeer Lambert law A= cd : molar Absorption coefficient c: solution concentration d.
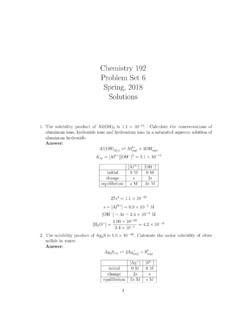
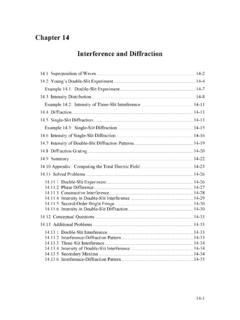
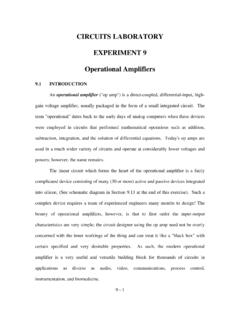
2 Path length Beer s Law only provides a good description of experimental results when c is very low! Transitions6 Conjugation (delocalization) impacts the energy required for electronic transitions7 E = EphotonEphoton = h c/ E = h c/ Derivation of the absorbance wavelength (nm)1. The energy level of a particle in one-dimensional box can be written as: Absorption of light by a molecule or ion is associated with a one electron jump from the HOMO (n1) to the LUMO (n2). Where N is an even number of electrons, n1=N/2, and n2=(N/2)+ 6*_____ 6*_____ 5*_____ 5*_____ 4* LUMO_____ ___ 4*____ __ 3 HOMO___ ____ 3____ __ 2___ __ 2____ _ 1___ __ 1 ENERGY93.
3 The energy change for the transition from HOMO to LUMO can be written as:4. Since E = Ephoton = h = hc/ , where : = wavelength,c = the speed of light ( *108ms-1) 5. Let s let p equal the number of carbons in the polymethine chain, then N = p + 3. (3 = the electrons from the nitrogen atoms). the approximation that L is the length of the chain between nitrogen atoms plus one bond distance on each side gives us L = (p + 3)l, where l is the bond length between atoms. The equation can now be written as10117. Substituting nm (the bond length in benzene) in for , plus the values for h,c,m, & N gives us 8. The box length L can be increased when there are easily polarizable groups at the ends of a carbon chain.
4 Taking this into account gives the following formulaFor the dye we will use as a standard, should lie between 0 & Three dyes will be used in this Experiment :12 Each dye is in methanol solution of with a concentration of approximately 1 x 10⁻⁴ BlueBlue a cuvette with about 2 mL of sample (dye) solution. The dyes can be run in any the spectrophotometer to find the absorbance maximum of the necessary ( the graph does not show a smooth peak and/or the maximum absorbance number exceeds ), dilute the sample by removing half the volume of the dye and replacing it with an equal amount of methanol. Reread the maximum absorbance. Repeat the dilution process until the maximum absorbance is below 1.
5 Record both max and the absorbance values of all the samples. Select one that has Absorbancebetween to to read off the above process with the other two dyes. Remember to record both max and the number of Moore, ; Wang, J. Pipet about 2ml of pure methanol into a cuvette (approximately 2/3 to of the cuvette).2. Insert the reference cuvette (methanol) into the rear cuvette holder. Do not insert the cuvette for the dye Click the Baseline button in the bottom left toolbar of the UV-Probe software. 4. Allow the scan to finish (note that the wavelength being scanned changes during this process). 5. Pipet about 2ml of one of the dyes into a second cuvette.
6 6. Insert the cuvette containing the dye into the front cuvette In the spectrum window, make sure that the Active tab is selected and then click the Start button in the bottom left toolbar of the software. 8. Allow the scan to Right-click in the spectrum window and hover the mouse over the crosshair option and then move the mouse cursor over to display. 10. Hover the cursor over the maximum absorbance peak and record the corresponding wavelength (x-axis) and absorbance (y-axis).11. If the absorbance reading is not between and then dilute the sample as mention previously until an absorbance reading that falls within acceptable range is Repeat steps 5-11 for the remaining 15 The dye solutions may dimerize, which can lead to a shoulder on the Absorption peak.
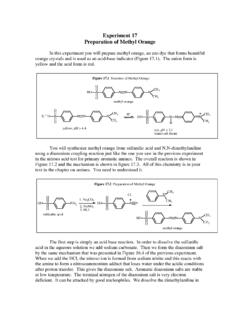
7 The extent of dimerization will vary depending upon the solution should use the larger peak in the spectrum; this Absorption should be due to the monomeric form that you want to Note on DimerizationCalculationsYou will be comparing your experimental results to thetheoretical values obtained from the free-electron modelcalculation discussed by plugging in the max value that you measured for 1,1 -Diethyl-4,4 -carbocyanine iodide. [Blue Dye!] your calculated value, determine max for the remaining the calculated max values with the values that you obtained If we use 1,1 -Diethyl-4,4 -carbocyanine iodide as an example, then p = 9. 2. If = *, solving the equation (in nm) = ((p + 3 + )2/(p + 4))gives us = ((9 + 3 + )2/(9 + 4)) = nm* This number was chosen for illustrative purposes ONLY.
8 It is NOT the value that you will use for . Your value for must be based on 1,1 -Diethyl-4,4 -carbocyanine iodide. Sample Calculation17 Laboratory Reports An outline of what is expected in your report for the first laboratory Experiment can be found in your course syllabus. (p. 14-15) In addition to what is described in the syllabus: Include the number of dilutions for each dye in your data table. In the Summary & Discussion section, use Beer s Law to explain why the samples needed to be diluted. Based on the number of dilutions required for each dye, answer the following question: If you were using a HPLC/UV instrument to study these dyes, which dye would have the lowest limit of detection?
9 You are responsible for reading this outline and writing a report that contains all of the required components. Your original data must be included with your Make sure that your cover page clearly indicates the author of the lab report. Points WILL BE DEDUCTED for Poor English, including poor grammar and spelling errors!!! *Reports will be collected in lab next week*. Remember the lateness policy!!19 Laboratory Reports Con t Procedure4. Signed Original Data5. Calculations6. Summary & Discussion The 7 general sections of your laboratory report are:Sample Cover PageExperiment 1: The Absorption Spectra of Conjugated DyesSeptember 12, 2018My Name Is: Jeff CanariaMy Lab Partner s Name Is: Sze Yang20