Transcription of CIC 1.SpectreRF Overview
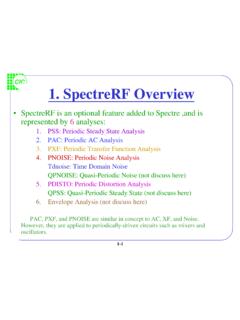
1 CIC. 1. SpectreRF Overview SpectreRF is an optional feature added to Spectre ,and is represented by 6 analyses: 1. PSS: Periodic Steady State Analysis 2. PAC: Periodic AC Analysis 3. PXF: Periodic Transfer Function Analysis 4. PNOISE: Periodic Noise Analysis Tdnoise: Time Domain Noise QPNOISE: Quasi-Periodic Noise (not discuss here). 5. PDISTO: Periodic Distortion Analysis QPSS: Quasi-Periodic Steady State (not discuss here). 6. Envelope Analysis (not discuss here). PAC, PXF, and PNOISE are similar in concept to AC, XF, and Noise. However, they are applied to periodically-driven circuits such as mixers and oscillators. 1-1. CIC. SpectreRF in a Design Flow Design Schematic Analog Artist Environment Models The netlists include all components along with an analysis selection, simulation Netlist controls and statements to save, plot nodes or currents. SPECTRE Engine Spectre RF Control Analog Artist Plot Results Use Direct plot or the Calculator plot capabilities. 1-2. CIC. SpectreRF Tool Flow SpectreRF.
2 No Stimuli is coperiodic PSS is a large-signal analysis Yes and determines the period of PDISTO Setup PSS setup the small-signal analyses. PSS requires that multiple Spectre Engine Spectre Engine periodic stimuli be PDISTO Analysis PSS Analysis coperiodic. PDISTO Results PSS Results PDISTO is also a large- signal analysis, and need not Spectre Engine to be run after a PSS. -PAC Analysis analysis. PDISTO does not -PXF Analysis require multiple periodic -PNOISE Analysis stimuli to be coperiodic. Report Results 1-3. CIC. SpectreRF Features Compute a steady-state solution efficiently and directly Handles very large circuits (~ 10,000 transistors). Displays results in both time and frequency domains Use Discrete Fourier Transform (DFT) for better accuracy Displays standard RF measurements, such as s-parameter in Smith chart, NF, IP3, and 1dB compression point in the Analog Artist design environment. Performs oscillator analysis. 1-4. CIC. 2. S-Parameter Analysis Linear simulation : Entirely in the frequency domain A basic RF feature of the Spectre simulator Ports: Specify the port number on the psin ( or port); psin (or port).
3 Can act as a source port or a load. Required properties for linear analysis: Resistance & Port number Noise Analysis: Use Nfmin and NF for 2-port circuits ONLY. 2-1. CIC. Plotting S- parameter simulation Results SP, ZP, YP, HP s-, z-, y-, and h- parameters GD group delay VSWR Voltage Standing Wave Ratio NFmin minimum noise figure Gmin reflection coefficient associated with Nfmin(also known as min, opt, or on). Rn noise sensitivity parameter rn normalized equiv. Noise resistance NF noise figure Kf & B1f stability terms GT transducer gain GA available gain, assuming conjugate matched output GP power gain, assuming conjugate matched input Gmax maximum available power gain Gmsg maximum stable power gain Gumx maximum unilateral power gain ZM impedance at port m NC noise circles GAC available gain circles GPC power gain circles LSB load stability circles SSB source stability circles 2-2. CIC. Lab1 : S-parameter Analysis Create a new library and a new schematic view. Use library analogLib create instance from & tsmc25rf to draw library tsmc25rf.
4 The scheme. After drawing, push Design Check and Save; then push Tools Analog Environment, and the window Affirma Analog Circuit Design Environment will appear. 2-3. CIC. Setup Design Environment(1). Push Setup Model Libraries then the window Model Library Setup . appears. Setup the model library as shown right. Then click OK. Push Setup . Simulator/Directory/Host to designate the project directory. The default project directory is ~/ simulation . Use Browse to access to the model files 2-4. CIC. Setup Design Environment(2). You can use either an absolute model path or a relative model path IF you use the absolute approach, the setup is as shown right-upper. To use a relative path ,push Setup simulation Files ,than Setup . Model Libraries .The setup is as shown right. 2-5. CIC. Setup Design Environment(3). Push Analyses Choose then the window Choosing Analyses appears. Key in the values as right and push ok, then some information will appear in the Analyses . domain of the window Affirma Analog Circuit Design Environment.
5 Push Select button then Push simulation Netlist and Run to run to select the port on the the simulation . The Netlist will be saved under schematic window a directory called ~/ simulation . Netlist and Run 2-6. CIC. See the Results Use the Direct Plot tool to look the results. In the S-parameter Results window choose some parameters to see their results. 2-7. CIC. Some Results 2-8. CIC. Save the results to *.s2p Edit the S-Parameter Options, and enter the path to the output S-parameter file in the file field of the OUTPUT. parameters section and OK the S-Parameter Options form. And Simulate again. Check if the file is created in the appointed directory. 2-9. CIC. S2P File 2-10. CIC. simulation State Push Session Save State to save simulation states under a directory called ~/.artist_states. Designate a new directory with the Session . Options command in the simulation window. Push Session Save State to load saved states for a design. 2-11. CIC. Read the S2P file(1). Create a new schematic view.
6 Use library analogLib . (n2port cell) to draw the scheme. Simulate if the results are the same as before. 2-12. CIC. 3. Lab2: Swept DC Analysis Create a new schematic view and use library analogLib & tsmc25rf to draw the scheme.. After Check and Save ; then call the window Affirma Analog Circuit Design Environment . Setup up the Model Libraries. Push Variables Copy From Cellview, and the defined variables appear in the Design Variables section. Double click on the variable name or push Variables Edit, the window Editing Design Variables . appears. Key in the appropriate value for the variables. 3-1. CIC. Set up the Design Environment(1). Call the window Choosing Analyses and key in the values as right and push ok. To plot power or current at the end of the simulation , you must explicitly save the currents necessary for the calculation before the simulation . The voltages at each node are saved by default. Select Outputs To Be Saved Select On Schematic. In the schematic, select the NMOS.
7 The terminals are circled in the schematic window after you select them. Press Esc to end the selections. 3-2. CIC. Set up the Design Environment(2). In the window Design Environment select Tools Parametric Analysis ;. the window Parametric Analysis appears, then key in the values as below . In the window Parametric Analysis select Analysis Start to start the simulation . 3-3. CIC. The Results Select Results Direct Plot DC and select the terminal Drain of the nmos in the schematic window; then push ESC, and the results will be showed. 3-4. CIC. 4. Periodic Steady State Analysis Directly computes the periodic steady-state response of a circuit in the time domain. Iterative Shooting Newton method is employed. Calculate frequency translations using the saved matrices at every time point. The fundamental frequency of the circuit or system is determined, based on integer multiples of all source frequencies. The circuit is evaluated for one period of the common frequency, and the period is adjusted until all node voltages and all branch currents fall within a specified tolerance.
8 4-1. CIC. Shooting Newton Method PSS operates by efficiently finding an initial condition that vi v results in steady state. vf The signal starts at a The starting point is adjusted The first iteration is transient point vi doesn't by the shooting method to simulation from t=0 to t=1/PSSfund result in periodicity. result in periodic steady state. by default. The tstab parameter can be adjusted to facilitate convergence. All node voltages Transient Analysis and Admittance PSS Analysis Matrices are saved The second iteration is PSS. analysis between t=tstab to tstab t=(tsatb+1/PSSfund) and compares all voltage and currents at the start and end of the shooting interval. Shooting Interval Set the value of tstab to keep t=0s t=1/PSSfundt=2/PSSfund start-up behavior away. 4-2. CIC. Shooting Newton Method(continued). 1 1. = =. PSS fund PSS fund Transient Analysis PSS Analysis RF IF 100 MHz Shooting method takes the last few point data at the end of the shooting interval to adjust the slopes of the LO waveform at the beginning of the next iteration.
9 PSSfund=100 MHz If 20 iterations do not yield a solution, this might indicate the circuit won't converge to a PSS solution. 4-3. CIC. PSS Analysis Assumptions 1st Assumption : Periodicity All stimuli are periodic and coperiodic with the PSSfund ; All responses are periodic. PSSfund can be set to includes the subharmonics. If periodicity assumptions fail, PSS analysis will not converge. 2nd Assumption : Linearity A near-linear relationship need to exist between initial and final points of the shooting interval. 4-4. CIC. The PSS Fundamental 150 MHz 10 MHz RF Input Mixer BPF Mixer BPF Output IF1 IF2. 900 MHz 1050 MHz 160 MHz Local Local Osc. Osc. PSSfund = 10 MHz 4-5. CIC. PSS Operation Initial Transient Start PSS (1 period or tstab). No 1 Period of Periodicity Meet? PSS Analysis Refine Initial Yes Guess Final State =. Initial State No Exit Yes 4-6. CIC. Simulator Accuracy Suggestions Do not set conservative . This will dramatically extend the simulation time. V and I < reltol * lteratio * steadyratio The suggested settings are recommended for IP3 Analysis, Noise Analysis, or wherever high accuracy is needed.
10 Choose the gear2only integration method. The default trap integration method yields underdamping and Parameter Defaults Suggested Settings gearOne yields too reltol 1e-3 1e-5. vabstol 1e-6 3e-8. much overdamping. iabstol 1e-12 1e-13. Method trap gear2only errpreset reltol relref method maxstep steady-ratio lteratio liberal allglobal gear2 < moderate sigglobal traponly < conservative alllocal gear2only < 4-7. CIC. Normalized Convergence ratio When the Conv norm is 1(unity) or less, the simulation meets the matching criterion. The PSS messages also display the number of PSS. iterations, the number of accepted timesteps, and the total time required for PSS analysis. Measured V between start and end of shooting interval Conv norm =. reltol*lteratio*steadyratio 4-8. CIC. Lab3 : PSS and swept PSS Analysis Create a new schematic view and use library analogLib &. tsmc25rf to draw the scheme. Port1: Frequency name: F1. Resistance: 50. Source type: sine Pif Amplitude(dBm): -40. Frequency: frf Port2: Frequency name: F2.


