Transcription of COMPARAISON DES PRIX DE L’ÉLECTRICITÉ - Accueil
1 COMPARAISON DES prix DE L lectricit DANS LES GRANDES VILLES NORD-AM RICAINEST arifs en vigueur le 1er av ril 2016 Coordonn par Communications avec la client le pour la direction Tarifs et conditions de service D p t l gal 3e trimestre 2016 Biblioth que et Archives nationales du Qu bec Biblioth que et Archives Canada ISBN 978-2-550-76242-3 (version imprim e) ISBN 978-2-550-76243-0 (PDF) Pour tout renseignement additionnel, veuillez communiquer avec la direction Tarifs et conditions de service d Hydro-Qu bec au num ro suivant : T l phone : 514 289-2211, poste 5537Ce document peut tre consult en ligne au publication is also available in DES prix DE L lectricit 2016 Coordinated by Communications avec la client le for Direction Approvisionnement en lectricit et tarification Legal deposit 3rd quarter 2017 Biblioth que et Archives nationales du Qu bec National Library of Canada ISBN 978-2-550-79283-3 (print version) ISBN 978-2-550-79284-0 (PDF) For further information, please contact Hydro-Qu bec s Direction Approvisionnement en lectricit et tarification at the following number: Tel.
2 : 514 289-2211, ext. 5596 This publication can be consulted online at document est galement publi en fran of Electricity Prices 100%2 017G13 82 A2 0172 017 Comparison of Electricity Prices in Major North American CitiesRates in effect April 1, 2017hydro quebec .com1 TABLE OF CONTENTSINTRODUCTION3 METHOD 9 HIGHLIGHTS 11 Residential Customers 11 Small-Power Customers 12 Medium-Power Customers 13 Large-Power Customers 16 DETAILED RESULTS1 Summary Tables (excluding taxes) 192 Summary Tables (including taxes) 253 Detailed Tables Residential 314 Detailed Tables Small Power 375 Detailed Tables Medium Power 436 Detailed Tables Large Power 49 APPENDICESA Rate Adjustments 55B Time-of-Use Rates Adjustment Clauses 59C Applicable Taxes 65D Utilities in the Study 733 INTRODUCTIONE very year, Hydro-Qu bec compares the monthly electricity bills of Qu bec customers in the residential, commercial, institutional and industrial sectors with those of customers of the various utilities serving 21 major North American report details the principal conclusions of this comparative analysis of prices in effect on April 1, 2017.
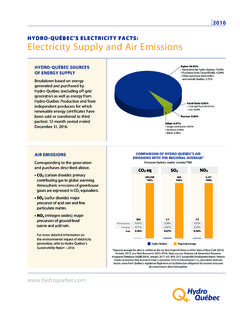
3 There are three sections. The first describes the method used to estimate electricity bills. The second examines the highlights of the seven consumption levels analyzed, with the help of charts. Finally, the third section presents the results of the 21 consumption levels for which data were collected and compiled in the form of summary and detailed tables. The most recent rate adjustments, time-of-use rates, adjustment clauses and applicable taxes, as well as a profile of the utilities in the study, appear in separate NORTH AMERICAN CITIESAVERAGE PRICES FOR RESIDENTIAL CUSTOMERS 1 (IN /k W h)2St. John s, N L: Edmonton, A B: Vancouver, B C: , P E: Calgary, A B: , N B: Seattle, W A: Regina, S K: , N S: Winnipeg, M B: Portland, O R: Montr al, Q C: , O N: Toronto, O N: Boston, M A: Detroit, M I: New York, N Y: , I L: San Francisco, C A: Nashville, T N: , T X: Miami, F L: 1927 Privy Council border (not final)Abbreviations UsedAB AlbertaBC British ColumbiaCA CaliforniaFL FloridaIL IllinoisMA MassachusettsMB ManitobaMI MichiganNB New BrunswickNL Newfoundland and LabradorNS Nova ScotiaNY New YorkON OntarioOR OregonPE Prince Edward IslandQC Qu becSK SaskatchewanTN TennesseeTX TexasWA Washington1) For a monthly consumption of 1,000 k W h.
4 Rates in effect April 1, ) In Canadian NORTH AMERICAN CITIESAVERAGE PRICES FOR LARGE-POWER CUSTOMERS 1 (IN /k W h)2St. John s, N L: Edmonton, A B: Vancouver, B C: , P E: Calgary, A B: , N B: Seattle, W A: Regina, S K: , N S: Winnipeg, M B: Portland, O R: , O N: Montr al, Q C: , O N: Boston, M A: Detroit, M I: New York, N Y: , I L: San Francisco, C A: Nashville, T N: , T X: Miami, F L: 1927 Privy Council border (not final)Abbreviations UsedAB AlbertaBC British ColumbiaCA CaliforniaFL FloridaIL IllinoisMA MassachusettsMB ManitobaMI MichiganNB New BrunswickNL Newfoundland and LabradorNS Nova ScotiaNY New YorkON OntarioOR OregonPE Prince Edward IslandQC Qu becSK SaskatchewanTN TennesseeTX TexasWA Washington1) For a monthly consumption of 3,060,000 k W h and a power demand of 5,000 kW; rates in effect April 1, ) In Canadian currency.
5 6 MAJOR CANADIAN CITIESOVERVIEW OF CHANGES IN AVERAGE PRICES FOR RESIDENTIAL CUSTOMERS (IN /k W h) 2013 TO 20171,2,3 AVERAGE PRICES FOR A RESIDENTIAL CUSTOMER (IN /k W h)1,2,320132014201520162017 Canadian citiesMontr al, , , , , , , , John s, , ON , , ) For a monthly consumption of 1,000 ) In Canadian ) Data from Comparison of Electricity Prices in Major North American Cities publications, Hydro-Qu bec, 2013 to /k W h7 MAJOR CANADIAN CITIESOVERVIEW OF CHANGES IN AVERAGE PRICES FOR LARGE-POWER CUSTOMERS (IN /k W h) 2013 TO 20171,2,3 AVERAGE PRICES FOR LARGE-POWER CUSTOMERS (IN /k W h)1,2,320132014201520162017 Canadian citiesMontr al, , , , , , , , John s, , ON , , ) For a monthly consumption of 3,060,000 kWh and power demand of 5,000 ) In Canadian ) Data from Comparison of Electricity Prices in Major North American Cities publications, Hydro-Qu bec, 2013 to /k W h9 METHODIn addition to Hydro-Qu bec, this comparative analysis of electricity prices across North America includes 22 utilities: 12 serving the principal cities in the 9 other Canadian provinces, and 10 utilities in American states.
6 The results are based, in part, on a survey to which 13 utilities responded, and in part on estimates of bills calculated by Hydro-Qu bec and confirmed in most cases by the utilities results presented here show the total bill for various consumption levels. If the bill is calculated according to an unbundled rate, it includes all components, including supply, transmission and COVERED Monthly bills have been calculated based on rates in effect on April 1, 2017. The most recent rate adjustments applied by the utilities in the study between April 1, 2016, and April 1, 2017, are shown in Appendix LEVELS Seven consumption levels were selected for analysis. However, data were collected for 21 consumption levels and those results are presented in the Detailed the exception of the bills presented in Section 2, taxes are not included in any of the calculations.
7 Appendix C lists taxes applicable on April 1, 2017, by customer category; those which may be partially or fully refundable are also PROGRAMSThe bills have been calculated according to base rates. Optional rates or programs offered by some utilities to their residential, commercial, institutional or industrial customers have not been taken into account since the terms and conditions vary considerably from one utility to the LOCATIONE lectricity distributors sometimes offer different rates in the various cities they serve. As well, taxes may vary from one region to another. This, however, is not the case in Qu bec, where, with the exception of territories north of the 53rd parallel, taxes and rates are applied uniformly. For the purposes of this study, the bill calculations estimate as closely as possible the actual electricity bills of consumers in each target city, based on rates in effect on April 1, RATESThe rates offered by some utilities vary depending on the season and/or time of day when energy is consumed.
8 In the United States, for example, a number of utilities set a higher price in summer, when demand for air-conditioning is stronger. In Qu bec, on the other hand, demand increases in winter because of heating requirements. Thus, for some utilities, April 1 may fall within a period in the year when the price is high, whereas for others it falls in a period when the price is low. An annual average price has therefore been calculated in the case of utilities with time-of-use rates which are listed in Appendix CLAUSESThe rates of some distributors include adjustment clauses that allow them to adjust their customers electricity bills according to changes in different variables. Since these adjustments may be applied monthly, or over a longer period, the electricity bills issued by a given distributor may have varied between April 1, 2016, and April 1, 2017, even though base rates remained the same.
9 Appendix B lists the adjustment clauses taken into account when calculating RATEThe exchange rate used to convert bills in dollars into Canadian dollars is (C A $ 1 = U S $ ), the rate in effect at noon on April 3, 2017. The Canadian dollar had thus depreciated by relative to the dollar on April 1, Electricity Rates effective April 1, 2017 sets out Hydro-Qu bec s rates, as approved by the R gie de l nergie (the Qu bec energy board) in accordance with Decision D-2017-034. Three types of rates are in effect: domestic rates, for residential customers, the industrial rate, for large-power industrial customers, and general rates, for other customers. General rates are applied according to minimum billing demand: small power, medium power and large power. For comparison purposes, the electricity bills of the utilities in the study have been analyzed according to these customer categories.
10 The industrial rate has been used to calculate the bills of large-power CUSTOMERSThe rate applicable to Hydro-Qu bec s residential customers is among the most advantageous in North America. For customers whose monthly consumption is 1,000 k W h, Montr al is once again in first place. Figure 1 illustrates the results of this bec = 100 Monthly bill (excluding tax)Rates in effect April 1, 2017 FIGURE 1100123146148157158175183189206213215215 2252282312323004024204390501002003004001 50250350450 Montr al, QCWinnipeg, MBEdmonton, ABCalgary, ABVancouver, BCSt. John s, NLHouston, TXMoncton, NBMiami, FLPortland, ORSeattle, WAChicago, ILNashville, TNOttawa, ONRegina, SKHalifax, NSToronto, ONCharlottetown, PEDetroit, MIBoston, MANew York, NYSan Francisco, CANew York, NYSan Francisco, CABoston, MADetroit, MIHalifax, NSCharlottetown, PERegina, SKToronto, ONOttawa, ONCalgary, ABHouston, TXNashville, TNMoncton, NBPortland, OREdmonton, ABChicago, ILSt.