Transcription of Computer 1 Endothermic and Exothermic Reactions
1 Computer 1 Chemistry with Vernier 1 - 1 Endothermic and Exothermic Reactions Many chemical Reactions give off energy. Chemical Reactions that release energy are called Exothermic Reactions . Some chemical Reactions absorb energy and are called Endothermic Reactions . You will study one Exothermic and one Endothermic reaction in this experiment. In Part I, you will study the reaction between citric acid solution and baking soda. An equation for the reaction is: H3C6H5O7(aq) + 3 NaHCO3(s) ! ! 3 CO2(g) + 3 H2O(l) + Na3C6H5O7(aq) In Part II, you will study the reaction between magnesium metal and hydrochloric acid. An equation for this reaction is: Mg(s) + 2 HCl(aq) H2(g) + MgCl2(aq) OBJECTIVES In this experiment, you will Study one Exothermic and one Endothermic reaction. Become familiar with using Logger Pro. Collect and display data on a graph.
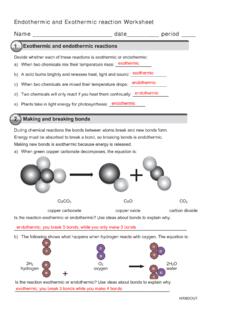
2 Figure 1 Computer 1 1 - 2 Chemistry with Vernier MATERIALS Computer Styrofoam cup Vernier Computer interface 250 mL beaker Logger Pro citric acid, H3C6H5O7, solution Temperature Probe baking soda, NaHCO3 50 mL graduated cylinder hydrochloric acid, HCl, solution balance magnesium, Mg PROCEDURE 1. Obtain and wear goggles. Part I Citric Acid plus Baking Soda 2. Place a Styrofoam cup into a 250 mL beaker as shown in Figure 1. Measure out 30 mL of citric acid solution into the Styrofoam cup. Place a Temperature Probe into the citric acid solution. 3. Connect the probe to the Computer interface. Prepare the Computer for data collection by opening the file 01 Endo Exothermic from the Chemistry with Vernier folder of Logger Pro. 4. Weigh out g of solid baking soda on a piece of weighing paper. 5. The Temperature Probe must be in the citric acid solution for at least 30 seconds before this step.
3 Begin data collection by clicking . After about 20 seconds have elapsed, add the baking soda to the citric acid solution. Gently stir the solution with the Temperature Probe to ensure good mixing. Collect data until a minimum temperature has been reached and temperature readings begin to increase. You can click on to end data collection or let the Computer automatically end it after 300 seconds. 6. Dispose of the reaction products as directed by your teacher. 7. To analyze and print your data: a. Click the Statistics button, . In the statistics box that appears on the graph, several statistical values are displayed for Temp 1, including minimum and maximum. In your data table, record the maximum as the initial temperature and the minimum as the final temperature. Close the statistics box by clicking the upper-left corner of the box. b.
4 To confirm the minimum and maximum temperatures, use the scroll bars in the table to scroll through the table to examine the data. Compare the minimum and maximum data points to those you recorded in the previous step. c. Print a copy of the table. Enter your name(s) and the number of copies. d. You will often want to change the scale of either axis of the graph. There are several ways to do this. To scale the temperature axis from 0 to 25 C instead of the present scaling, click the mouse on the 40 tickmark at the top of the axis. In place of the 40 , type in 25 and press the ENTER key. Notice that the entire axis readjusts to the change you made. Use the same method to change the 10 tickmark to 0 . Note: A second option is to click the Autoscale button, . The Computer will automatically rescale the axes for you. e. You can also expand any portion of the graph by zooming in on it.
5 Select the area you want to zoom in on. Do this by moving the mouse pointer to the beginning of this section of data press the mouse button and hold it down as you drag across the curve, leaving a Endothermic and Exothermic Reactions Chemistry with Vernier 1 - 3 rectangle. Then click the Zoom In button, . The Computer will now create a new, full-size graph that includes just the region inside the rectangle. You can reverse this action by clicking the Undo Zoom button, . f. When you again collect data in Part II of this experiment, the data will be collected as Latest run, the most recent set of data you have collected. The original Latest run will be lost if it is not saved or stored. Choose Store Latest Run from the Experiment menu to store Latest as Run 1, then save or print it later. Note that the line for Run 1 is thinner than it was for Latest.
6 To hide the curve of your first data run, click the Temperature vertical-axis label of the graph, click More, and uncheck Run 1 Temperature. Click . Part II Hydrochloric Acid Plus Magnesium 8. Manually rescale the vertical axis to the original temperature scale of 10 to 40 C. To do so, click the mouse on the bottom tickmark and type in 10 . Then click on the top tickmark and type in 40 . 9. Measure out 30 mL of HCl solution into the Styrofoam cup. Place the Temperature Probe into the HCl solution. Note: The Temperature Probe must be in the HCl solution for at least 45 seconds before doing Step 11. CAUTION: Hydrochloric acid is caustic. Avoid spilling it on your skin or clothing. Wear chemical splash goggles at all times. Notify your teacher in the event of an accident. 10. Obtain a piece of magnesium metal from the teacher. 11.
7 Begin data collection by clicking . After about 20 seconds have elapsed, add the Mg to the HCl solution. Gently stir the solution with the Temperature Probe to ensure good mixing. CAUTION: Do not breathe the vapors! Collect data until a maximum temperature has been reached and the temperature readings begin to decrease. 12. Dispose of the reaction products as directed by your teacher. 13. To analyze your Part II data: a. Change the appearance of the graph by double-clicking anywhere on the graph bring up the Graph Options dialog. Check the box in front of Point Protector a point protector will now outline each data point on the graph window in this trial, click the Examine button, . The cursor will become a vertical line. As you move the mouse pointer across the screen, the temperature and time values corresponding to its position will be displayed in the box at the upper-left corner of the graph.
8 Scroll across the initial 3-4 points to determine the initial temperature. Record the initial temperature in the data table. Move the mouse pointer across the peak of the temperature curve to determine the maximum temperature, and record it as the final temperature in your data table. To remove the examine box, click the upper-left corner of the box. b. It is also possible to calculate statistics just for a portion of your collected data. To do so, you must first select the data you are interested in. For example, you might want to find the average (or mean) of the first few data points to use as an initial temperature, instead of using the minimum value. Select the flat portion of the curve move the mouse pointer to time 0 and drag across the flat part of the curve. Now click the Statistics button, , and note the mean temperature value in the statistics box on the graph.
9 This value is the mean of only the selected data points. When you are done, click on the upper-left corner of the statistics box to remove it. 14. To print a graph of temperature vs. time showing both data runs: a. Click the Temperature vertical-axis label of the graph. To display both temperature runs, click More, and check the Run 1 Temperature and Latest Temperature boxes. Click . Computer 1 1 - 4 Chemistry with Vernier b. Label both curves by choosing Text Annotation from the Insert menu, and typing Endothermic (or Exothermic ) in the edit box. Then drag each box to a position near its respective curve. Adjust the orientation of the arrowhead by clicking and dragging to the desired position. c. Print a copy of the graph. Enter your name(s) and the number of copies of the graph you want. 15. Save the temperature and time data from both data runs.
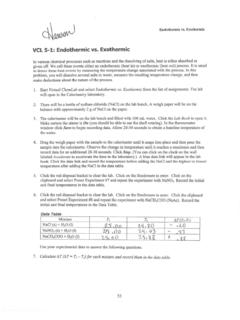
10 Choose Save As from the File menu and give the file a distinct name. As directed by your teacher, choose a location for the file, and click . DATA TABLE Part I Part II Final temperature, t2 C C Initial temperature, t1 C C Temperature change, t C C OBSERVATIONS Citric Acid Reaction White/Nontransparent Big Bubbles Fizzing sound Liquid Baking Soda dissolves Hydrochloric Acid Reaction Bubbles (not as strong as citric acid) Magnesium metal slowly dissolves Liquid Not purely transparent, but not fully white PROCESSING THE DATA 1. Calculate the temperature change, t, for each reaction by subtracting the initial temperature, t1, from the final temperature, t2 ( t = t2 t1). 2. Tell which reaction is Exothermic . Explain. The reaction between magnesium metal and hydrochloric acid is Exothermic , because it released energy in the form of heat (increase of temperature).