Example: quiz answers
Concentration Inequalities - UPF
bound for the moment generating function of the random variables Xi X i. There are many ways of doing this. For bounded random variables perhaps the most elegant version is due to Hoe ding [31] which we state without proof. Lemma 1. hoeffding’s inequality. Let Xbe a random variable with X= 0, a X b. Then for s>0, esX es2(b a)2=8:
Tags:
Information
Domain:
Source:
Link to this page:
Documents from same domain

ECONOMETRICS III: FINANCIAL ECONOMETRICS
www.econ.upf.eduIntroductory Econometrics for Finance Cambridge University Press. An easy, introductory book, that also contains directions on carrying out analysis with Eviews and

Chapter 4 Measures of distance between samples: Euclidean
www.econ.upf.edu4-2 angled triangle, the square on the hypotenuse (the side denoted by A in Exhibit 4.1) is equal to the sum of the squares on the other two sides (B and C); that is, A 2 = B 2 + C 2. Exhibit 4.1 Pythagoras’ theorem in the familiar right-angled triangle, and the
Introduction to Statistical Learning Theory
www.econ.upf.eduThe main goal of statistical learning theory is to provide a framework for study-ing the problem of inference, that is of gaining knowledge, making predictions, making decisions or constructing models from a set of data. This is studied in a statistical framework, that is there are assumptions of statistical nature about
Chapter 15
www.econ.upf.edubusiness processes environment such as optimizing routing distribution, supply chain design, production scheduling and resource allocation. Inventory warehousing costs Production purchase costs Transportation costs Transportation costs SUPPLY DEMAND Reverse supply chain Information flow Figure 15 .1 . An example of a supply chain

The Visual Display of Quantitative Information
www.econ.upf.edudisplay of quantitative materials. The basic structures for showing data are the sentence, the table, and the graphic. Often two or three of these devices should be combined. The conventional sentence is a poor way to show more than ... 1976 election day survey by NeC News.

Introduction to latent variable models
www.econ.upf.eduItem Response Theory models: models for items (categorical responses) measuring a common latent trait assumed to be continuous (or less often discrete) and typically representing an ability or a psychological attitude; the most important IRT model was proposed by Rasch (1961); typically no covariates are included

Chapter 5 Measures of distance between samples: non …
www.econ.upf.eduMeasures of distance between samples: non-Euclidean Euclidean distances are special because they conform to our physical concept of distance. But there are many other distance measures which can be defined between multivariate samples. These non-Euclidean distances are of different types: some still satisfy the basic

Chapter 7 Hierarchical cluster analysis
www.econ.upf.edu7-2 Exhibit 7.1 Dissimilarities, based on the Jaccard index, between all pairs of seven samples in Exhibit 5.6. For example, between the first two samples, A and B, there are 8 species that occur in on or the other, of which 4 are matched and 4 are mismatched – the proportion of …

GESTION PUBLICA: CONCEPTOS Y METODOS - UPF
www.econ.upf.edude la aplicación de teorías importadas: Las de Taylor2, a principios de siglo, y las que desarrollaron Edward Deming y Joseph Juran a partir de los trabajos realizados, en la década de los años treinta, por W Shewhart y otros en los laboratorios de Western Electric (posteriormente AT&T Bell). El éxito práctico de las teorías exportadas ha
Related documents
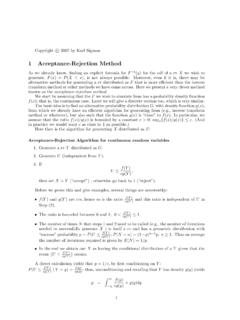
1 Acceptance-Rejection Method - Columbia University
www.columbia.eduHere then is the algorithm for generating X distributed as F: Acceptance-Rejection Algorithm for continuous random variables 1. Generate a rv Y distributed as G. 2. Generate U (independent from Y). 3. If U ≤ f(Y) cg(Y), then set X = Y (“accept”) ; otherwise go back to 1 (“reject”).

C Programming Introduction to Arduino and
catsr.vse.gmu.eduTwo functions are available for working with random numbers. random() and randomSeed()Generating Random Numbers random(min, max) : returns a random number between min and max -1 random(max) : returns a random number between 0 and max -1 randomSeed(seed): Initializes the random number generator, causing it to restart at an …
Introduction to Stochastic Processes - Lecture Notes
web.ma.utexas.edu1.1 Random variables Probability is about random variables. Instead of giving a precise definition, let us just metion that a random variable can be thought of as an uncertain, numerical (i.e., with values in R) quantity. While it is true that we do not know with certainty what value a random variable Xwill take, we
Practice Exam Answer Key - WikiEducator
wikieducator.orga. Independent variables b. Confounding variables c. Dependent variables d. Sampling bias 16. To avoid experimenter bias and subject bias researchers employ a. the single‐blind procedure b. the double‐blind procedure c. random sampling d. the naturalistic observation method 17.

RESEARCH METHODOLOGY Methods and tools use in …
pharmaquest.weebly.comanswer the questions. Many different methods and procedures have been developed to aid in the acquisition of data. Methods are used for the collection of the data and Tools are used for the analysis of the data. This chapter covers all the details of the methods and tools which are used in the research.

Selecting Research Participants - SAGE Publications Inc
www.sagepub.comthe experimental group and 20 to a control group. This would be an example of random assignment of participants to conditions. In Chapter 7, we will discuss experimental designs where random assignment will be used to create the groups in a study. Figure 6.1 illustrates the difference between random selection and random assignment. Systematic ...

Bland-Altman Plot and Analysis - NCSS
ncss-wpengine.netdna-ssl.comSuppose you want to evaluate the agreement between a continuous random variable 1 and a second random X variable X 2 which each measure the same variable, such as blood pressure. Assume that n paired observations (X 1k, X 2k), k = 1, 2, …, n are available. The Bland-Altman plot (1983) is formed by plotting the differences X 1 - X 2
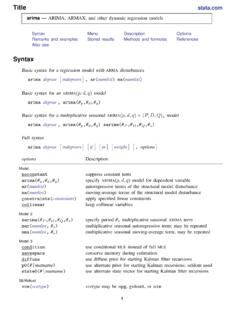
Title stata.com arima — ARIMA, ARMAX, and other dynamic ...
www.stata.comarima— ARIMA, ARMAX, and other dynamic regression models 3. arima D.y, ar(1/2) ma(1/3) is equivalent to. arima y, arima(2,1,3) The latter is easier to write for simple ARMAX and ARIMA models, but if gaps in the AR or MA lags are to be modeled, or if different operators are to be applied to independent variables, the
Hand-book on STATISTICAL DISTRIBUTIONS for …
www.stat.rice.eduInternal Report SUF–PFY/96–01 Stockholm, 11 December 1996 1st revision, 31 October 1998 last modification 10 September 2007 Hand-book on STATISTICAL