Example: stock market
Confidence Intervals for Linear Regression Slope
Confidence Intervals for Linear Regression Slope Introduction This routine calculates the sample size n ecessary to achieve a specified distance from the slope to the confidence limit at a stated confidence level for a confidence interval about the slope in simple linear regression.
Tags:
Information
Domain:
Source:
Link to this page:
Documents from same domain

Mixed Models - Repeated Measures - Statistical …
ncss-wpengine.netdna-ssl.comMixed Models – Repeated Measures Introduction ... analysis, and the amount of data available for the analysis. When more than one fixed factor may influence the

Repeated Measures Analysis - NCSS
ncss-wpengine.netdna-ssl.comThis section provides the technical details of the repeated measures designs that can be analyzed by PASS. Earlier ... Repeated Measures Analysis ...

Chapter 469 Decomposition Forecasting - NCSS
ncss-wpengine.netdna-ssl.comChapter 469 Decomposition Forecasting Introduction Classical time series decomposition separates a time series into five components: mean, long-range trend, seasonality, cycle, and randomness. The decomposition model is Value = (Mean) x (Trend) x (Seasonality) x (Cycle) x (Random).

Chapter 575 Probit Analysis - Statistical Software
ncss-wpengine.netdna-ssl.comChapter 575 Probit Analysis Introduction Probit Analysis is a method of analyzing the relationship between a stimulus (dose) and the quantal (all or nothing) response. Quantitative responses are almost always preferred, but in many situations they are not practical. In these cases, it is only possible to determine if a certain response (such as ...

Chapter 720 Probit Analysis - Statistical Software
ncss-wpengine.netdna-ssl.comChapter 720 Probit Analysis. Introduction . Probit and logit analysis may be used for comparative LD. 50. studies for testing the efficacy of drugs designed to prevent lethality. This program module presents calculates power and sample size using the methodology outlined

Chapter 311 Stepwise Regression - Statistical Software
ncss-wpengine.netdna-ssl.comNCSS Statistical Software NCSS.com © NCSS, LLC. All Rights Reserved.

Chapter 208 Paired T-Test - NCSS
ncss-wpengine.netdna-ssl.comNCSS Statistical Software NCSS.com Paired T-Test 208-6 © NCSS, LLC. All Rights Reserved. Tests Alpha Alpha is the significance leve l used in the hypothesis tests.

Multivariate Analysis of Variance (MANOVA)
ncss-wpengine.netdna-ssl.comNCSS Statistical Software NCSS.com Multivariate Analysis of Variance (MANOVA) 415-4 © NCSS, LLC. All Rights Reserved. Assumptions and Limitations

Chapter 194 Normality Tests - NCSS
ncss-wpengine.netdna-ssl.comNCSS Statistical Software NCSS.com © NCSS, LLC. All Rights Reserved.

Distribution Weibull Fitting - NCSS
ncss-wpengine.netdna-ssl.comDistribution (Weibull) Fitting Introduction This procedure estimates the parameters of the exponential, extreme value, logistic, log-logistic, lognormal, normal, and Weibull probability distributions by maximum likelihood. It can fit complete, right censored, left censored, interval censored (readou t), and grouped data values.
Related documents

Confidence Intervals and Hypothesis Testing
juejung.github.ioConfidence Intervals and Hypothesis Testing Multiple Choice Identify the choice that best completes the statement or answers the question. ____ 1. The librarian at the Library of Congress has asked her assistant for an interval estimate of the mean number of books checked out each day. The assistant took a sample and found the mean to be 880 ...

Confidence Intervals for the Odds Ratio in Logistic ...
ncss-wpengine.netdna-ssl.comConfidence Intervals for the Odds Ratio in Logistic Regression with One Binary X Introduction Logistic regression expresses the relationship between a binary response variable and one or more independent variables called covariates. This procedure calculates sample size for the case when there is only one, binary
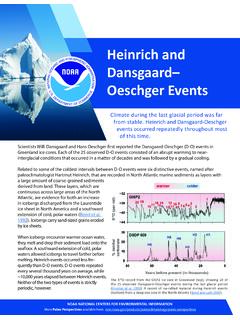
Heinrich and Dansgaard– Oeschger Events
www.ncei.noaa.govRelated to some of the coldest intervals between D-O events were six distinctive events, named after paleoclimatologist Hartmut Heinrich, that are recorded in North Atlantic marine sediments as layers with a large amount of coarse-grained sediments derived from land. These layers, which are continuous across large areas of the North

Lecture 12 Linear Regression: Test and Confidence Intervals
www2.isye.gatech.edu10 Properties of Regression Estimators slope parameter β1 intercept parameter β0 unbiased estimator unbiased estimator 414 CHAPTER 11 SIMPLE LINEAR REGRESSION AND ...