Transcription of Control Charts in the Analytical Laboratory
1 Chapter 6 Control Charts in the Analytical Laboratory References Reichenba cher l Ju rgen W. Einax , Challenges in Analytical Quality Assurance, springer, 2011. Chapter 8 2. Piotr Konieczka and Jacek Namie snik Quality Assurance and Quality Control in the Analytical Chemical Laboratory : A Practical Approach, Taylor & Francis Group, 20009. Chapter 3. W. Funk, V. Dammann, G. Donnevert, Quality Assurance in Analytical Chemistry: Applications in Environmental, Food, and Materials Analysis, Biotechnology, and Medical Engineering , John Wily, 2007. Chapter Introduction/ Control Charts For any Laboratory that performs a particular activity time and time again, showing the results in a Control chart is a good way to monitor the activity and to discover whether a change has caused some deviation in the expected results. Walter Shewhart in 1924 designed a chart to indicate whether or not the observed variations in the percent of defective apparatus of a given type are significant; that is, to indicate whether or not the product is satisfactory This was the first Control chart, and it has been the basis of statistical quality Control ever since The data obtained regularly from the QC materials are, in general, evaluated by Control Charts .
2 The user can define warning and action limits on the chart to act as alarm bells when the system is going out of Control . A Control chart is simply a chart on which measured values of whatever is being measured are plotted in time sequence, for instance, the successive values obtained from measurement of the quality Control sample. By plotting this information on a chart, a graph is produced in which the natural fluctuations of the measured value can readily be appreciated. Introduction/ Control Charts Control Charts are extremely valuable in providing a means of monitoring the total performance of the analyst, the instruments, and the test procedure and can be utilized by any Laboratory . There are a number of different types of Control Charts but they all illustrate changes over time. In the following, Shewhart Charts and CuSum Charts will be described. Shewhart Charts It is typically used to monitor day to-day variation of an Analytical process.
3 Measurement value is plotted on the y-axis against time or successive measurement on the x-axis. The measurement value on the y-axis may be expressed as an absolute value or as the difference from the target value. The QC sample is a sample typical of the samples usually measured by the Analytical process, which is stable and available in large quantities. This QC sample is analyzed at appropriate regular intervals in the sample batches. Shewhart Charts As long as the variation in the measured result for the QC sample is acceptable, it is reasonable to assume that the measured results for test samples in those batches are also acceptable. How do we determine what is acceptable and what is not? First of all, the QC sample is measured a number of times (under a variety of conditions which represent normal day-to-day variation). The data produced are used to calculate an average or mean value for the QC sample, and the associated standard deviation.
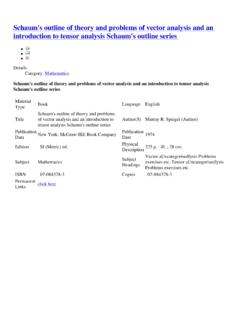
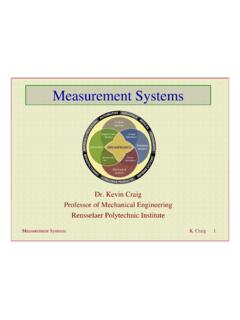
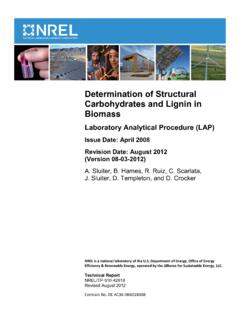
4 The mean value is frequently used as a target value on the Shewhart chart, the value to aim for . The standard deviation is used to set action and warning limits on the chart. Shewhart Charts Once the chart is set up, day-to-day QC sample results are plotted on the chart and monitored to detect unwanted patterns, such as drift or results lying outside the warning or action limits. In the Figure below, Shewhart Charts have been used to show four types of data: (a) data subject to normal variation, (b) as in (a) but displacement from the target value, (c) gradual drift and (d) step-change. To keep things simple, action and warning limits have only been included in (a). The general pattern of a Shewhart chart The general pattern of a Shewhart chart and the curve of the normal distribution of the Analytical results obtained in the pre-period with the true value and the limits at the significance levels P = and P = ; respectively Shewhart Charts The mean value Control chart corresponds to the original form of the Shewhart chart; however, in contrast to industrial product quality Control , it is mostly applied to single values in Analytical chemistry.
5 A mean value Control chart serves mainly to validate the precision of an Analytical process. Since systematic changes such as trends can also be detected, the accuracy may also be monitored to a limited extent. The central line of the Control chart is a mean value around which the measured values obtained by observations vary at random. The mean value is the true value obtained by measurements of an in-house reference material or given from certified reference materials. Mostly, the assigned value is obtained in the pre-period, or the mean of the most recent observations considered to be under Control should be used as the centre line. Measured values which lie on the central line are assumed to be unbiased. Shewhart Charts for mean values Shewhart Charts for mean values Using the mean and the standard deviation s obtained, the upper and lower action limit lines UAL and LAL and the upper and lower warning limit lines UWL and LWL, respectively, are constructed, as in the following equations Warning limit lines WL: Action limit lines AL:: Note that the warning limit lines are also called Control limit lines CL.
6 In practice, the standard deviation s will be unknown and will have to be estimated from historical data. On the assumption that the frequency distribution of the measured values follows a normal distribution, the three-sigma (3 0r 3s) limits include of the area under a normal curve, and the two-sigma (2 or 2s) lines include of the values, as shown in the Fig. The general pattern of a Shewhart chart The general pattern of a Shewhart chart and the curve of the normal distribution of the Analytical results obtained in the pre-period with the true value and the limits at the significance levels P = and P = ; respectively Shewhart Charts In other words: The range of 2s on either side of the central line covers of the area underneath the curve, i. e. the probability of a false alarm in this area is , and a single transgression of this limit is tolerated.
7 The probability of a value exceeding the 3s limit is , i. e., if this occurs, then it is with fair certainty an out-of- Control situation. During the evaluation of data from the preliminary period, the detection of an out-of- Control situation already present in this period indicates that corrective measures are urgently required before routine analysis can begin A Shewhart Control chart constructed according to the Figure given above can be applied as: Mean Control chart, preferably, for recognition of the precision or trends of an Analytical method. Blank Control chart, for Control of reagents and measurement instruments. Note that blank Control Charts include not Analytical results but measured values. Recovery Control chart, for Control of proportional systematic errors caused by the matrix. We will deal with the mean Control chart Preparing the Control chart Conduct 10 20 measurements for a standard sample.
8 Calculate the mean xm and the standard deviation SD; both values should be determined for the unbiased series, that is, after the initial rejection of outliers. Test the hypothesis about a statistically insignificant difference between the obtained mean and the expected value using Student s t test If the hypothesis is not rejected, start preparation of the first chart: the consecutive numbers of result determinations on the x-axis of the graph, and the values of the observed characteristics (the mean) on the y-axis. a central line CL on the graph corresponding to the reference values of the presented characteristic, and two statistically determined Control limits, one line on either side of the central line; the upper and lower Control limits (UAL and LAL, respectively), or in other words the upper and lower warning limits. 3. Both the upper and lower limits on the chart are found within 3SD from the central line, where SD is the standard deviation of the investigated characteristics.
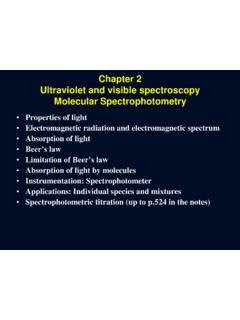
9 3SD (so-called action limits) show that approximately of the values fall in the area bounded by the Control lines, provided that the process is statistically ordered. The possibility of transgressing the Control limits as a result of random incident is insignificantly small; hence, when a point appears outside the Control limits 3SD it is recommended that action be taken on the chart. Limits of 2SD are also marked; however, the occurrence of any value from a sample falling outside these limits is simply warning about a possible transgression of the Control limits; therefore, the limits of 2SD are called warning limits (UWL and LWL). Mark the obtained measurement results for 20 consecutive samples as follows: How to read the measurement results on the chart If a determination result is located within the warning limits, it is considered satisfactory. The occurrence of results between the warning limits and action limits is also acceptable; however, not more often than two results per 20 determinations.
10 If a result for a test sample is found outside the action limits, or seven consecutive results create a trend (decreasing or increasing), calibration should be carried out again. There exist three other signs indicating the occurrence of a problem in the analyzed arrangement, namely: How to read the measurement results on the chart Three consecutive measurement points occurring outside the warning limits, but within the action limits. Two subsequent measurement points being outside warning limits, but in the interval determined by the action limits, on the same side of the mean value. Ten consecutive measurement points being found on the same side of the mean value. The most likely explanation when a point exceeds a Control limit is that a systematic error has occurred or the precision of the measurement has deteriorated. Shewhart Control Charts based on the standard deviation of the mean In some cases the number of replicates appears in the standard deviation of the mean (= / n), are used to set the acceptable limits of the graph The chart is made according to the following steps: 1.