Transcription of CRITICAL REVIEW FORM FOR SYSTEMATIC REVIEW: [CEBM]
1 CRITICAL Appraisal Worksheet: SYSTEMATIC REVIEW /Meta-analysis 1. What question did the SYSTEMATIC REVIEW address? The main question should be clear and focused. It should describe the population, intervention/exposure, and outcomes of interest. 2. Is it likely that all relevant studies (published and unpublished) were identified? Look for a comprehensive search for studies in relevant bibliographic databases ( MEDLINE, Cochrane, EMBASE); a search of reference lists from relevant studies; contact with experts; search for unpublished studies. The search should not be limited to English language only. The search strategy should include both controlled vocabulary terms ( MeSH) and text words. 3. Were the criteria used to select articles for inclusion predetermined, clearly stated, and appropriate?
2 The inclusion or exclusion of studies should be a clearly defined a priori. The eligibility criteria should specify the patients, interventions or exposures, outcomes of interest, and study designs. 4. Were the included studies sufficiently valid? Was the methodological quality of each study assessed using predetermined criteria appropriate to the type of study ( randomization, allocation concealment, and follow-up for randomized controlled trials) 5. Were studies selected and data extracted by 2 or more individuals? There should be at least 2 independent selectors/extractors and a tie -breaking procedure for disagreements. 6. Were the results similar from study to study? Ideally, the results of the included studies should be similar (homogeneous). If heterogeneity exists, the authors may estimate whether the differences are significant (chi-square test).
3 Possible reasons for the heterogeneity should be explored. 7. Conflict of interest Sources of support and other potential conflicts should be acknowledged and addressed. 8. Clinical Importance 8a. What were the results of the REVIEW ? (Are the results of all included studies clearly displayed? Are the results similar from study to study? Is there a clinical bottom line? If the study results were combined, was it appropriate to do so?) 8b. How precise are the results? (What is the confidence interval? p-value?) 8c. Did the interpretation of the REVIEW s results accurately reflect the results themselves? Are the results generalizable? 6/10/14 9. How are the results presented? The SYSTEMATIC REVIEW provides a summary of the data from the results of a number of individual studies.
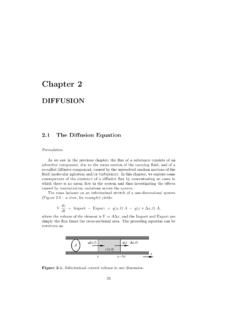
4 If the results of the individual studies are similar, a statistical method (called meta-analysis) is used to combine the results from the individual studies and an overall summary estimate is calculated. The meta-analysis gives weighted values to each of the individual studies according to their size. The individual results of the studies need to be expressed in a standard way, such as relative risk, odds ratio or mean difference between the groups. Results are traditionally displayed in a figure, like the one below, called a forest plot. The forest plot depicted above represents a meta-analysis of 5 trials that assessed the effects of a hypothetical treatment on mortality. Individual studies are represented by a black square and a horizontal line, which corresponds to the point estimate and 95% confidence interval of the odds ratio.
5 The size of the black square reflects the weight of the study in the meta-analysis. The solid vertical line corresponds to no effect of treatment - an odds ratio of When the confidence interval includes 1 it indicates that the result is not significant at conventional levels (P> ). The diamond at the bottom represents the combined or pooled odds ratio of all 5 trials with its 95% confidence interval. In this case, it shows that the treatment reduces mortality by 34% (OR 95% CI to ). Notice that the diamond does not overlap the no effect line (the confidence interval doesn t include 1) so we can be assured that the pooled OR is statistically significant. The test for overall effect also indicates statistical significance (p< ). Exploring heterogeneity Heterogeneity can be assessed using the eyeball test or more formally with statistical tests, such as the Cochran Q test.
6 With the eyeball test one looks for overlap of the confidence intervals of the trials with the summary estimate. In the example above note that the dotted line running vertically through the combined odds ratio crosses the horizontal lines of all the individual studies indicating that the studies are homogenous. Heterogeneity can also be assessed using the Cochran chi-square (Cochran Q). If Cochran Q is statistically significant there is definite heterogeneity. If Cochran Q is not statistically significant but the ratio of Cochran Q and the degrees of freedom (Q/df) is > 1 there is possible heterogeneity. If Cochran Q is not statistically significant and Q/df is < 1 then heterogeneity is very unlikely. In the example above Q/df is <1 ( ) and the p-value is not significant ( ) indicating no heterogeneity.
7 Note: The level of significance for Cochran Q is often set at due to the low power of the test to detect heterogeneity. Adapted from: Clegg, Andrew, Hewitson, Paul, and Milne, Ruairidh. Explicit and reproducible: how to assess the quality of the evidence in a SYSTEMATIC REVIEW . StudentBMJ. 8:24. Feb. 2000 Heneghan, Carl and Badenoch, Douglas. Evidence-based Medicine Toolkit, 2nd edition. Oxford: Blackwell Publishing; BMJ Books. 2006. p. 27. SYSTEMATIC REVIEW Appraisal Sheet. Centre for Evidence Based Medicine. University of Oxford [ ] AMSTAR, the validated SYSTEMATIC REVIEW measurement tool: 6/10/14