Transcription of Custom WaveView - Synopsys
1 DatasheetCustom WaveViewWaveform Viewer and Simulation Post-processing ToolOverviewCustom WaveView is a graphical waveform viewer and simulation post-processing tool for analog and mixed-signal ICs. Custom WaveView features fast loading, display scrolling, and zooming of very large waveform files, multiple simulator format support, and a rich set of analog and mixed-signal analysis WaveView is a full analog and mixed-signal display and analysis environment, reading simulation results from either analog or digital simulators and allowing complete conversion between views.
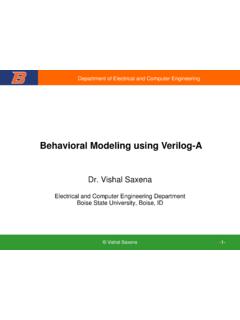
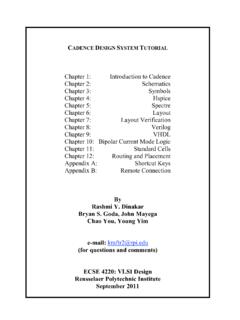
2 For instance, Custom WaveView can read-in the analog results of an HSPICE simulation, convert those waveforms to digital (single or multi-bit with user-selectable thresholds) and export those results for use in a digital simulation. Custom WaveView also provides a host of capabilities for displaying, measuring, manipulating and saving simulation results. In addition to multiple panels containing waveforms, Custom WaveView can also display more than one waveform tab allowing the designer to mix-and-match time and frequency domains in a single 1: Custon WaveView Main WindowCustom WaveView2 Benefits``High-performance waveform database I/O to quickly access large amounts of simulation data``Extensive mixed-signal display functions and analysis capabilities to extract measurements from simulation results``Single waveform tool for multiple simulators``Built-in support for HSPICE.
3 MEASURE command and parametric plots for .ALTER simulations``Transient, AC, RF, mixed-signal display and analysis``Optional Tcl API for programming complex user post-processing scripts``Flexible waveform grouping add multiple waveform views, either from different simulator runs on the same circuit netlist or from different netlists Single Waveform Tool for Multiple SimulatorsCustom WaveView is completely integrated with Synopsys Galaxy Custom Designer implementation tool and supports cross-probing with the Custom Designer SE schematic editor.
4 Custom WaveView will also read many common SPICE, FastSPICE, and verilog simulator waveform files from Synopsys , Mentor, and cadence .`` Synopsys yCustomSim , FineSim , FineSim Pro, HSPICE, and VCS `` cadence Design Systems ySpectre/RF, UltraSim, and Incisive``Mentor Graphics yModelSim, Eldo, ADMS, ADiT, HyperLynx Waveform Display Custom WaveView s advanced user interface allows the user to browse waveform data hierarchies and then drag-and-drop multiple selected signals into a waveform display window. Waveforms in the display window can have one or more non-overlapping panels.
5 Panels in a window can be arranged as either a vertical stack or as independent rows and columns. Rows and columns may be vertical, horizontal, or display includes:``Hierarchy browser and signal list``Waveform display via data drag-and-drop``Signal search with pattern-matching and wildcard; drag-and-drop from search results``User-definable Hot Keys``Recent Files List``Stack or Row column signal display``Save and Restore sessionCustom WaveView supports many different time and frequency domain waveform types, such as: ``Analog``Digital``Smith chart``Polar plot``2-D, 3-D sweep``Eye diagram``HistogramMeasurements Cursors, Monitors and the Measurement ToolCursorsCustom WaveView provides an unlimited number of cursors specifically for interactive on-screen measurement of waveforms.
6 Set to either the vertical or horizontal mode, these cursors can be moved around the waveform and display X-at-Y information Monitors can be added to the waveform panels to perform more complex measurements. Monitors include Derivative, Inverse Derivative, Delta Value, Cursor Average, Minimum/ Maximum/Average, Peak-to-Peak and RMS values of a given ToolCustom WaveView s powerful Measurement tool provides a wealth of domain-specific measurements that simplify design analysis. The Measurement tool provides rapid-on waveform display of over 35 types of measurements.
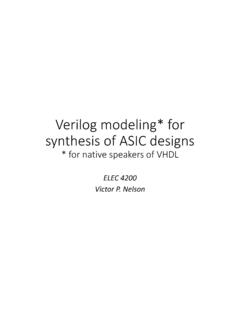
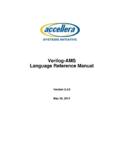
7 Measurements are persistent across sessions and can be replayed against a new set of simulation results as needed (see Figure 2). As simulation results change, measurements are updated automatically, presenting the user with the latest information available. The Measurement tool supports many measurements including time domain, frequency domain, statistical, level, S-domain, and DisplayCursorsMonitorsMeasurement ToolExtensible and OpenCustomizable GUII ndustry Standard Design Platform IntegrationsAll Supported File FormatsToolboxes and AssistantsEye DiagramsDFT/FFTADC Design ToolboxJitter ToolboxWaveform Post-processing with the Mixed-Signal Equation BuilderFeaturesCustom WaveView3 Figure 2: Measurement ToolFigure 4: Analog-to-Digital ConversionFigure 3.
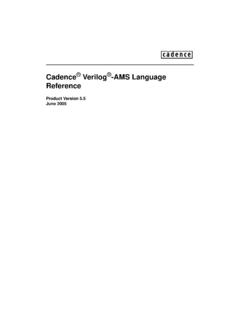
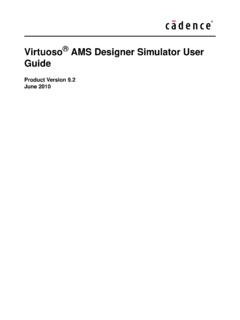
8 Eye DiagramEye DiagramsCustom WaveView s eye diagram capability allows users to easily create a folded eye diagram from complex waveforms. The eye diagram is constructed by automatically extracting the clock cycle, or by reference to an ideal clock, or to an external signal. Once constructed, the Automatic Eye Measurement tool can take eye opening or aperture measurements as well as create a jitter histogram. Figure 3 shows a typical eye diagram with cursors used to measure the eye width. Waveform Post-processing A-to-D; D-to-A ConversionAnalog waveforms can be converted to single-bit or multi-bit logic waveforms using user-specified threshold criteria (See figure 4).
9 Similarly, logic waveforms can be converted to analog waveforms (see figure 5) based on user-specified analog levels using either fixed-rate sampling or value transition Reduction and ExportRedundant data points can be automatically removed based on a user-specified error tolerance. Data can then be exported and saved using several different formats such as tabulated, SPICE PWL, WDF, VCD, and M-file (Ma tL ab).DFT/FFTC ustom WaveView supports FFT and DFT operations on time-domain data using various windowing functions (see figure 6). FFT/DFT will also automatically measure the signal-to-noise ratio (SNR), total harmonic distortion (THD), signal-to-noise and distortion ratio (SNDR), and effective number of bits (ENB).
10 Measurements also include:``Snap-to-wave feature``Measure update on reload``Glitch detection``Measurement export (as .Meas )``On-screen measure drawing``HSPICE measure tool Custom WaveView4 Toolboxes and Assistants Custom WaveView s toolboxes are provided to simplify specific measurements for a variety of common activities in waveform analysis. Assistants are provided to simplify common tasks that improve accuracy and customer productivity. ADC Design Toolbox Custom WaveView s ADC toolbox (see figure 7) provides the necessary information when working with analog- to-digital converters (ADCs).