Transcription of Data Collection at the Amusement Park - iPage
1 data Collection at the Amusement park Clarence Bakken Gunn High School (retired) Palo Alto, CA Vernier Software & Technology 13979 SW Millikan Way Beaverton, Oregon 97005-2886 (888) 837-6437 FAX (503) 277-2440 data Collection at the Amusement park . Copyright 2001 by Vernier Software & Technology. All rights reserved. You are entitled to reproduce parts of this book for use in your school only. No part of this book may be used or reproduced in any other manner without written permission of Vernier Software & Technology except in the case of brief quotations embodied in critical articles or reviews. The terms CBL, CBL 2, Calculator-Based Laboratory, and TI-GRAPH LINK are either registered trademarks, trademarks, or copyrighted by Texas Instruments, Inc.
2 Vernier LabPro, Logger Pro, Graphical Analysis are registered trademarks of Vernier Software & Technology. All other marks not owned by Vernier Software & Technology that appear herein are the property of their respective owners, who may or may not be affiliated with, connected to, or sponsored by Vernier. Published by Vernier Software & Technology 13979 SW Millikan Way Beaverton, Oregon 97005-2886 (888) 837-6437 FAX (503) 277-2440 Fourth Edition 2007 Third Edition 2004 Second Edition 2003 First Edition 2001 First Printing Printed in the United States of America -ii- data Collection at the Amusement park Table of Contents Introduction 1 Instrumentation Traditional Accelerometers 3 Electronic Accelerometers 3 Barometer 5 WDSS 6 Carrying Equipment 6 Electronic data Collection Equipment Needed 8 Steps for Collecting data 8 Specific Steps 8 Sampling Rate 9 Orientation 9 Calibrating Sensors 9 Zeroing Sensors 10 Vector Sum for 3-Axis Accelerometers 10 Smoothing data 11 Pre-trip Suggestion 12 Ride Suggestions
3 Directions on Rides 12 Dips 12 Vertical Loops 13 Corners 13 Barrels 13 Starts And Stops 13 Scramblers 14 Investigations at the park 14 Extensions 15 Web Sites 15 Appendix 1 WDSS Remote Option 16 Appendix 2 Logger Pro Remote Option 19 Appendix 3 Logger Pro Remote Option 20 Appendix 4 Using Calculator EasyData Program 21 Appendix 5 Using Calculator DataMate Program 23 Appendix 6 Using Calculator PHYSICS Program 25 Appendix 7 Using Palm OS 27 Appendix 8 Video Analysis 30 Appendix 9 Video Syncing 33 Appendix 10 Creating A Ride Profile 36 Appendix 11 Accelerometers and Forces 38 Appendix 12 Sample Worksheet for data Collection 41 Appendix 13 Questions & Answers 43 -iii- Introduction Since the mid-1980's, physics teachers have been taking their students to Amusement parks in ever-increasing numbers.
4 The purpose of such trips is to study the forces and accelerations that students experience on various rides and to apply science concepts to help explain their experiences. These concepts include Newton's laws, momentum, energy, centripetal force, projectile motion and free fall. This booklet discusses many of the issues and decisions relative to collecting data at an Amusement park , including specific directions for data Collection with Vernier equipment. While most references will be to collecting data on roller coasters, the discussion applies equally to other rides one encounters at an Amusement park . Interpreting data gathered at the Amusement park is a learned activity. Students need guidance in determining what to look for and how to make sense of the wiggles and squiggles on the graphs.
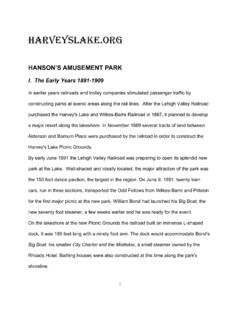
5 This document doesn t go into interpretation. However, the forthcoming second edition of the Handbook on Amusement park Physics, available from AAPT in mid-2007, will discuss data interpretation and give several examples. Grizzly at Paramount's Great America in Santa Clara, CA. Physics Day at Paramount's Great America in Santa Clara, CA, is one of the larger physics days. The Gunn High School Physics Club has operated a booth at Physics Day since 1995. Students check out accelerometer units consisting of an interface (CBL , CBL2 or LabPro ), one or more accelerometers and a carrying case or DataVest (or a WDSS ) to take on a ride. When the ride is done, the students return to the Electronic data Center to download their data and print their graphs.
6 The data is then published through the Physics Day web site ( ) so they can download it back at their schools. Experience has shown several things. Practice using the equipment before going to the park is essential for a successful physics day. Plan ahead to make the most of your data Collection experience. Capturing data from an entire ride, while interesting, is not necessarily the best strategy. It is often better to focus on one section of the ride rather than the whole. -1- Smoothing data often makes it easier to interpret. Collecting three axes of data is often preferable to a single axis, although valuable insight can be gained with single-axis accelerometers.
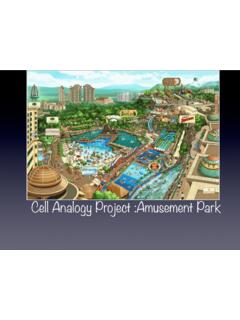
7 Computers are more efficient for downloading and displaying data than calculators, although calculators can still be used effectively to load instructions into an interface. Invertigo at Paramount s Great America The major sections of this document are as follows: Instrumentation While there is discussion of both traditional and electronic instrumentation for use at the Amusement park , the primary focus of this document is on electronic sensors and the software that drives them. data Collection This section discusses the steps one takes to gather electronic data . Several issues such as calibrating sensors and smoothing data are also discussed. Ride Suggestions This section discusses several aspects of Amusement park rides. What are some of the key questions to have students focus on while they are riding?
8 A must-read section if you are going to the Amusement park for the first time. Appendices There are thirteen (13) appendices to this document, including specific step-by-step instructions for seven different combinations of sensors, interfaces and computer/ calculator/Palm. Two sections cover video capabilities built into Logger Pro beginning with version A section on Creating A Ride Profile precedes a discussion of Accelerometers and Forces. A sample worksheet for students is included, too. A section of questions and answers completes this document. Although we may not have covered every possible question that you or your students will have, we have tried to hit most of the highlights. For questions about sensors, interfaces or software, contact Vernier Software & Technology by email at or by phone at (888) 837-6437.
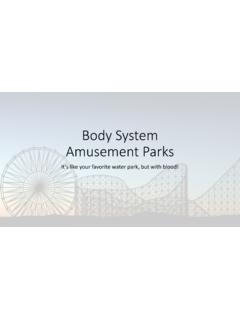
9 -2- We d like to thank Paramount s Great America in Santa Clara, California, and Six Flags Marine World in Vallejo, California, for the use of specific ride photographs in this document. Instrumentation Traditional Accelerometers Before the availability of electronic data - Collection technology, students traditionally used hand-carried devices called accelerometers . In general, these accelerometers measured the forces felt by a mass attached to a spring or rubber band, by the behavior of a mass on a string hanging from a protractor, or BB s in a curved tube. The forces acting on the object with small mass is proportional to the force felt by our larger mass.
10 We interpret the readings as acceleration or more properly, force/mass (force per unit mass). If the small mass feels a force that is double its weight, then the person holding the mass is also experiencing a force that is twice their weight. In this case, both the person and the mass experience forces that we can say are equal to 2 g s. While many people may call the reading of these devices acceleration, what they really measure is the ratio of force/mass. See Appendix 9 for further discussion of this topic. Traditional handheld devices are limited due to three factors: 1. Students are occupied trying to watch the measuring instrument at the same time that they are being terrified by the ride experience. Accuracy is questionable.