Example: stock market
Data visualization with ggplot2 : : CHEAT SHEET
Data visualization with ggplot2 : : CHEAT SHEET ggplot2 is based on the grammar of graphics, the idea that you can build every graph from the same components: a data set, a coordinate system, and b geoms—visual marks that represent data points. Basics GRAPHICAL PRIMITIVES a + geom_blank() and a + expand_limits() Ensure limits include values across all plots.
Tags:
Information
Domain:
Source:
Link to this page:
Documents from same domain
Deploying Custom Microsoft Office Templates …
raw.githubusercontent.comDEPLOYING CUSTOM MICROSOFT OFFICE TEMPLATES WITH SYSTEM CENTER CONFIGURATION MANAGER Page 2 of 25 Author Trevor …
AWS IoT Developer Guide - GitHub
raw.githubusercontent.comAWS IoT Developer Guide AWS IoT Components. Accessing AWS IoT AWS IoT provides the following interfaces to create and interact with your things: ... • AWS Lambda—Runs your code on vir tual servers from Amaz on EC2 in response to e vents. For more information, see AWS Lambda.

Dates and times with lubridate : : CHEAT SHEET
raw.githubusercontent.comJanuary xxxxxx Time Zones R recognizes ~600 time zones. Each encodes the time zone, Daylight Savings Time, and historical calendar variations for an area. R assigns one time zone per vector. Use the UTC time zone to avoid Daylight Savings. OlsonNames() Returns a list of valid time zone names. OlsonNames() Sys.timezone() Gets current time zone.
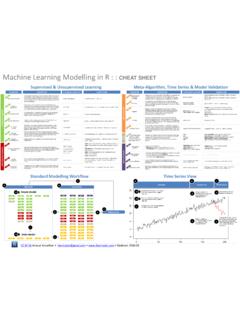
Machine Learning Modelling in R : : CHEAT SHEET
raw.githubusercontent.comClassification: Accuracy, precision, Simple models with ew parameters areeasier to compute but lead to poorer fits (high bias). Complex models more fits but over-fit the data 'high variance) Cross validation compares the test performances of different model realisations with different sets or values of parameters

Last revision: 18 August 2021 - raw.githubusercontent.com
raw.githubusercontent.comBalanced Balanced mode produces a super resolution image approximating native rendering quality, with a major performance gain compared to native. 1.7x per dimension (2.89x area scale) (59% screen resolution) 1129 x 635 1506 x 847 2024 x 847 2259 x 1270 1920 x 1080 2560 x 1440 3440 x 1440 3840 x 2160 Performance Performance mode visibly impacts ...
ART FILM - TOP TEXT
raw.githubusercontent.comr77 d31 r120 r116 c63 r172 r174 c102 u6 c106 j2 m2 c2 he3 pb10 24v-r66 d10 d13 r74 r83 r91 r90 r89 r124 c53 r170 d29 r181 c105 l9 c49 c108 motor2_1 driver2 a1b2 fan0 j50 pa8 pb11 he3 +-r82 d14 d17 q4 r86 u4 c109 d35 r113 c65 c107 r7 r6 j7 b1 fan1 pe5 + j51 fan0 24v 5v 12v-+ r92 ... d23 r98 r43 q8 d27 r99 r57 r167 r168 c31 r106 j72 c81 c87 c83 ...
Machine Learning Cheat Sheet - GitHub
raw.githubusercontent.comPreface This cheat sheet is a condensed version of machine learning manual, which contains many classical equations and diagrams on machine learning, and aims to help you quickly recall knowledge and ideas in machine learning.
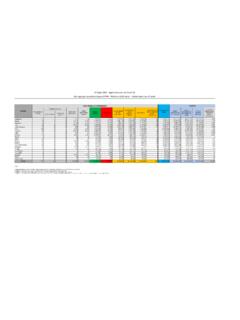
Data Transformation with data.table :: CHEAT SHEET
raw.githubusercontent.comData Transformation with data.table :: CHEAT SHEET Manipulate columns with j ... CC BY SAErik Petrovski• www.petrovski.dk• Learn more with the data.table homepageor vignette• data.table version 1.11.8 • Updated: 2019-01 BIND Apply function to cols. ... abc 1aNA 2a1 3bNA 4b3 5b4 ab 1a 2a 3b 4b ...
Aggiornamento casi Covid-19 - Dati aggregati quotidiani ...
raw.githubusercontent.comLa regione Campania comunica che 1 dei decessi registrati oggi, risale al giorno 03/01/2022. La regione Emilia Romagna comunica che è stato eliminato 1 caso, comunicato nei giorni precedenti, in quanto giudicato non caso COVID-19 e che in seguito all’adeguamento informatico per una segnalazione più tempestiva dei casi, relativamente ai casi ...
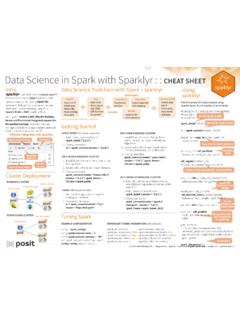
Push Data Science in Spark with sparklyr
raw.githubusercontent.comft_imputer() - Imputation estimator for completing missing values, uses the mean or the median of the columns ft_index_to_string() - Index labels back to label as strings ft_interaction() - Takes in Double and Vector type columns and outputs a flattened vector of their feature interactions Translates into Spark SQL statements DPLYR VERBS Wrangle
Related documents

R Markdown Cheat Sheet - GitHub Pages
danzhuibing.github.iocolortheme Beamer color theme to use X css CSS file to use to style document X X X dev Graphics device to use for figure output (e.g. "png") X X X X X X X duration Add a countdown timer (in minutes) to footer of slides X ... rmarkdown-cheatsheet-2.0 Created Date:

Excel 2016 Keyboard Shortcuts Cheatsheet
www.nsuk.comShortcuts Cheatsheet Move to the previous cell in a worksheet or the previous option in a dialog box. Move one cell up in a worksheet. Move one cell down in a worksheet. Move one cell left in a worksheet. Move one cell right in a worksheet. Move to the edge of the current data region in a worksheet. Enter End mode, move to the next nonblank cell in

Adobe Illustrator CC Shortcut Cheatsheet
images.template.netllustrator CC Windows Files New..... Ctrl+N New File (No Dialog) .....

HTML5 Cheat Sheet - WebsiteSetup
websitesetup.orgcolor of text Defines a footer for a section or page Defines a form accept-charset, action, autocomplete, enctype, method, name, novalidate, target Used to define one particular window (frame) within a frameset Used to define a frameset, which organized multiple windows (frames) Defines header 1 to header 6 Defines information about the document

Colors in R - Department of Statistics
www.stat.columbia.educolor name color name gray8 gray9 gray10 gray11 gray12 gray13 gray14 gray15 gray16 gray17 gray18 gray19 gray20 gray21 gray22 gray23 gray24 gray25 gray26 gray27 gray28

1 Emmet | Cheat Sheet SYNTAX Child: > Child ...
docs.emmet.ioForm, Input, Button form <form action=""></form> form:get <form action="" method="get"></ form> form:post <form action="" method="post"></ form> label

SQL Cheat Sheet - Programming with Mosh
programmingwithmosh.comSQL Cheat Sheet Mosh Hamedani Code with Mosh (codewithmosh.com) 1st Edition

rmarkdown : : CHEAT SHEET
raw.githubusercontent.comOUTPUT FORMAT CREATES html_document.html pdf_document*.pdf word_document Microso! Word (.docx) powerpoint_presentation Microso! Powerpoint (.pptx) odt_document OpenDocument Text rtf_document Rich Text Format md_document Markdown github_document Markdown for Github ioslides_presentation ioslides HTML slides slidy_presentation Slidy HTML slides …