Example: stock market
Deep One-Class Classification - Proceedings of Machine ...
2(0;1] is (i) an upper bound on the fraction of outliers, and (ii) a lower bound on the fraction of support vectors (points that are either on or outside the boundary). This re-sult is known as the -property (Scholkopf et al.¨ ,2001) and allows one to incorporate a prior belief about the fraction of
Tags:
Information
Domain:
Source:
Link to this page:
Documents from same domain

TPOT: A Tree-based Pipeline Optimization Tool for ...
proceedings.mlr.pressJMLR: Workshop and Conference Proceedings 64:66{74, 2016 ICML 2016 AutoML Workshop TPOT: A Tree-based Pipeline Optimization Tool for Automating Machine …
Ensembles for Time Series Forecasting
proceedings.mlr.pressEnsembles for Time Series Forecasting set of real world time series. Our results clearly indicate that this is a promising research direction. In Section2we provide a brief description of the tasks being tackled in this paper.
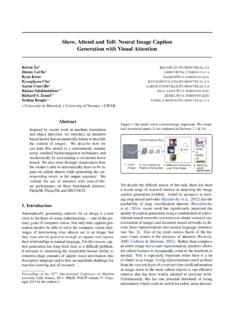
Show, Attend and Tell: Neural Image CaptionGeneration …
proceedings.mlr.pressShow, Attend and Tell: Neural Image Caption Generation with Visual Attention Kelvin Xu? [email protected] Jimmy Lei Bay [email protected] Ryan Kirosy [email protected] Kyunghyun Cho?
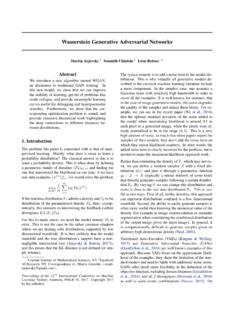
Wasserstein Generative Adversarial Networks
proceedings.mlr.pressWasserstein Generative Adversarial Networks Figure 1: These plots show ˆ(P ;P 0) as a function of when ˆis the EM distance (left plot) or the JS divergence (right plot).The EM plot is continuous and provides a usable gradient everywhere.
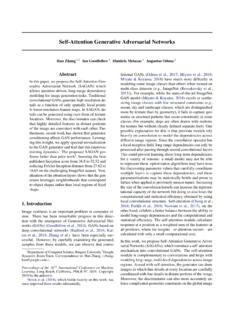
Self-Attention Generative Adversarial Networks
proceedings.mlr.pressSelf-Attention Generative Adversarial Networks Figure 1. The proposed SAGAN generates images by leveraging complementary features in distant portions of the image rather than local regions of fixed shape to generate consistent objects/scenarios. In each row, the first image shows five representative query locations with color coded dots.
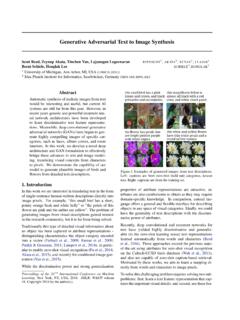
Generative Adversarial Text to Image Synthesis
proceedings.mlr.pressdeep convolutional decoder networks to generate realistic images.Dosovitskiy et al.(2015) trained a deconvolutional network (several layers of convolution and upsampling) to generate 3D chair renderings conditioned on a set of graph-ics codes indicating shape, position and lighting.Yang et al. (2015) added an encoder network as well as actions ...

On the di culty of training recurrent neural networks
proceedings.mlr.pressOn the di culty of training recurrent neural networks @Et+1 @xt+1 Et Et+1 Et 1 xt 1 xt +1 ut +11 u tu @Et @xt @Et1 @xt1 @ xt +2 @xt +1 @x +1 x @xt1 @xt1 @xt2 Figure 2. Unrolling recurrent neural networks in time by creating a copy of the model for each time step.

Deep Gaussian Processes
proceedings.mlr.pressrepresentational power of a Gaussian process in the same role is significantly greater than that of an RBM. For the GP the corresponding likelihood is over a continuous vari-able, but it is a nonlinear function of the inputs, p(yjx) = N yjf(x);˙2; where N j ;˙2 is a Gaussian density with mean and variance ˙2. In this case the likelihood is ...
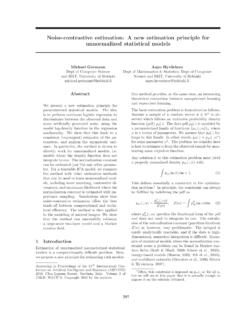
Noise-contrastive estimation: A new estimation principle ...
proceedings.mlr.pressated noise y. The estimation principle thus relies on noise with which the data is contrasted, so that we will refer to the new method as “noise-contrastive estima-tion”. In Section 2, we formally define noise-contrastive es-timation, establish fundamental statistical properties, and make the connection to supervised learning ex-plicit.
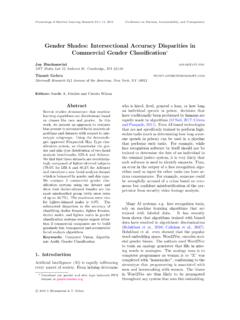
Gender Shades: Intersectional Accuracy Disparities in ...
proceedings.mlr.press117 million Americans are included in law en-forcement face recognition networks. A year-long research investigation across 100 police de-partments revealed that African-American indi-viduals are more likely to be stopped by law enforcement and be subjected to face recogni-tion searches than individuals of other ethnici-ties (Garvie et al.,2016).
Related documents
SEVENTH EDITION Using Multivariate Statistics
www.pearsonhighered.com4.1.4 Outliers 62 4.1.4.1 Detecting Univariate and Multivariate Outliers 63 4.1.4.2 Describing Outliers 66 4.1.4.3 Reducing the Influence of Outliers 66 4.1.4.4 Outliers in a Solution 67 4.1.5 Normality, Linearity, and Homoscedasticity 67 4.1.5.1 Normality 68 4.1.5.2 Linearity 72 4.1.5.3 HomoscedasticityHomogeneity ...

214-29: Assessing Model Fit and Finding a Fit Model
support.sas.comOutliers will affect the fit. There are techniques for detecting them Πsome better than others- but there is no universal way of dealing with them. Plots, smoothing plots such as PROC LOESS and PROC PRINCOMP help detect outliers. If there is a sound reason why the data point should be disregarded then the outlier may be deleted form analysis.

統計実務におけるレンジチェックの ... - Stat
www.stat.go.jpexamination includes detecting extreme values using editing bounds for the quantitative data. Since the data size of the official statistical surveys tends to be large, the editing bounds are often prepared in advance using the previous survey data in which outliers are inevitable. Under ordinary circumstances, outliers may not be properly

Tips and Tricks for Analyzing Non-Normal Data
www.qualitymag.comThis article will cover various methods for detecting non-normal data, and will review valuable tips and tricks for analyzing non-normal data when you have it. The 10 data points graphed here were sampled from a normal distribution, yet the histogram appears to be skewed. Helpful hint: Avoid histograms for small sample sizes.