Transcription of EARNED SCHEDULE FOR AGILE PROJECTS
1 THE MEASURABLE NEWSThe Quarterly Magazine of the College of Performance Management | EARNED SCHEDULE for AGILE PROJECTS (AgileES) combines the speed and responsiveness of AGILE with the accuracy and control of EARNED SCHEDULE . AgileES adds value to common AGILE tools that are used for assessing SCHEDULE performance. It also removes an AGILE concern with EARNED Value s SCHEDULE performance metrics. Using EARNED SCHEDULE on AGILE PROJECTS is not without controversy, but there is strong, objective proof that it is valid for AGILE PROJECTS . In short, AgileES deserves a place in the AGILE tool its introduction a decade ago, EARNED SCHEDULE (Lipke, 2003) has improved the ability of PROJECTS to measure and track SCHEDULE performance. Traditional EARNED Value Management (EVM) measures SCHEDULE performance in units of currency. EARNED SCHEDULE measures it in units of time a richer and more intuitive While the use of EARNED SCHEDULE on plan-driven PROJECTS is growing, its adoption by AGILE PROJECTS is stalled.
2 There are several reasons for the , AGILE PROJECTS use EVM (AgileEVM) to manage cost performance. Their use of EVM for SCHEDULE management is limited there is doubt that it adds value beyond what is provided by common AGILE tools. Consider this observation concerning the use of EVM on two AGILE test PROJECTS :The Product Owners for both PROJECTS felt that the AgileEVM metrics did not provide any more SCHEDULE insight than the burndown chart provided.. We agree that without the need to manage cost performance, AgileEVM does not add significant value above traditional burndown methods. (Sulaiman, T., Barton, B., & Blackburn, T., 2006) There is also a concern with EVM s traditional SCHEDULE performance metrics. As a project approaches completion, EVM s metrics invariably show SCHEDULE performance improving. At the end of a project , the performance appears to be perfect, even if the project is delivered late. That is counter-intuitive, if not simply , there are concerns within the AGILE community about using EVM in any form.
3 Based on negative experience, some claim that EVM is merely bureaucratic overhead. Others, who have had positive experience with EVM, dispute the claim. The debate persists. AgileES applies EARNED SCHEDULE to AGILE PROJECTS and addresses all of these concerns. AgileES practice demonstrates value-add for traditional burndown methods and improved accuracy versus traditional EVM SCHEDULE performance metrics. AgileES theory objectively proves the validity of AgileES for AGILE PracticeAgileES quantifies SCHEDULE performance efficiency. EARNED SCHEDULE measures the amount of time EARNED on a project . The SCHEDULE Performance Index for time (SPIt) compares the amount of time EARNED to the actual time, thus indicating how well or poorly time is being used on the project . The SPIt yields a profile of SCHEDULE performance that goes beyond burn charts and gives AGILE teams additional information to use in identifying and correcting deviations. A recent project that used AgileES illustrates the point.
4 The project , call it AgileEStest, was a classic AGILE project : it was a software development initiative done by a team with several years of AGILE experience. The team prepared a product backlog, a relative sizing, and a release plan. The planned staffing level on the project was ten team members, all of whom were co-located. The sprints were two weeks long, and the original end date was four months after the start. The budget was a half-million dollars. EARNED SCHEDULE FOR AGILE PROJECTSBy Robert Van De Velde, PhD, PMP30 The Measurable News | week, the team gathered EVM data for a spreadsheet that was used to do AGILE and AgileES calculations. No additional data collection was required for AgileES. Metrics generated from the spreadsheet were used in regularly scheduled team meetings. Grooming of the release plan was done at the end of each a snapshot taken part way through the project (Figure 1). The snapshot includes Burndown and AgileES metrics that will be explained project had a bad start.
5 Actual staffing levels were significantly lower than planned. As a result, SCHEDULE performance efficiency was low. At the end of Sprint 3, the staffing level was brought to the full complement of ten, but due to the delay already incurred and the addition of a large number of new release points, a major plan revision was required. The number of sprints and budget were increased, the target date was delayed, and the contents of the sprints were re-organized. With the new baseline, the project was essentially Robert Van De Velde 20132yields a profile of SCHEDULE performance that goes beyond burn charts and gives AGILE teams additional information to use in identifying and correcting deviations. A recent project that used AgileES illustrates the point. The project , call it AgileEStest, was a classic Agileproject: it was a software development initiativedone by a team with several years of AGILE experience. The teamprepared a product backlog, a relative sizing, and a release plannedstaffing level on the projectwas ten team members, all of whom were co-located.
6 The sprints were two weeks long, and the original end date was four months after the start. The budget was a half-million week, the team gathered EVM data for a spreadsheet that was used todoAgile and AgileES calculations. No additional data collection was required for AgileES. Metrics generated from the spreadsheetwere used inregularly scheduled team the release planwas done at the end of each a snapshot taken part way through the project (Figure 1). The snapshot includes Burndown and AgileES metricsthat will be explained project had a bad start. Actual staffing levels were significantly lower than planned. As aresult, SCHEDULE performanceefficiency was low. At the end of Sprint 3, the staffing level was brought to the full complement of ten, but due to the delay already incurred and the addition of a large number of new release points, a major plan revision was required. The number of sprints and budget wereincreased, the target date was delayed, and the contents of the sprints were re-organized.
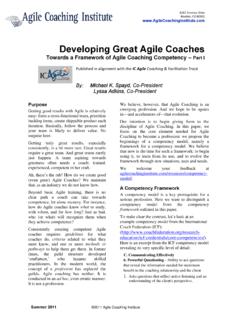
7 With the new baseline, the project was essentially restarted. Figure 1: project AgileEStestBurndown, SPIt, and Ideal BurndownThe chart focuses on the restarted project . It depicts the burndown (the blue squares) beginning withthe number of release points actually completed at the end of Sprint 4and running as far asSprint those unfamiliar with burndown charts, theyarecommonly used on AGILE projectsfor 0 1000 2000 3000 4000 5000 6000 1 2 3 4 5 6 7 8 9 10 11 12 13 AgileEStest Burndown, SPIt , and Ideal Burndown Burndown SPIt IdealBurn Release PointsIndexValueSprintsPlanned FinishRe-baselineThe chart focuses on the restarted project . It depicts the burndown (the blue squares) beginning with the number of release points actually completed at the end of Sprint 4 and running as far as Sprint 9. For those unfamiliar with burndown charts, they are commonly used on AGILE PROJECTS for assessing SCHEDULE performance. The charts show how much work has been completed and, by inference, how much remains on the project .
8 The chart in Figure 1 also contains an Ideal Burndown line (the yellow dotted line). It runs from the first sprint of the re-baseline to the last planned sprint. It starts with the number of release points that should have been completed at the end of Sprint 4 and finishes at Sprint 11 with no remaining release points. If the actual Burndown runs below the line, the project is ahead of SCHEDULE , and if it runs above the line, the project is behind the re-baseline, the Burndown line shows a steady decline in the number of remaining release points. Through Sprint 8, the results appear to run on or slightly above the Ideal Burndown line, indicating that the project is on or slightly behind SCHEDULE . At Sprint 9, the results jump above the Ideal Burndown line, indicating that the project is definitely behind SCHEDULE . AgileES clarifies what is happening. As shown by the SPIt line (the red triangles), SCHEDULE performance efficiency improves over the first four sprints of the new baseline, but after the fourth, Sprint 7, performance steadily declines.
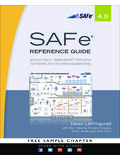
9 While the Burndown line highlights the deviation at Sprint 9, the shortfall began at Sprint 7. Root cause analysis of the delay should start there, rather than with the later sprint. Burndown charts show the outcome of SCHEDULE performance efficiency: greater efficiency means more release points are consumed, less efficiency means fewer release points are consumed. The outcome is that the project is either on, ahead of, or behind SCHEDULE . By contrast, AgileES assesses SCHEDULE performance efficiency itself and not just the outcome of that performance efficiency. It shows explicitly how time is being used and thereby adds insight to what is provided by common AGILE tools such as burn Measurable News | discussion thus far has been framed exclusively in terms of SPIt , intentionally omitting EVM s SCHEDULE Performance Index (SPI). As alluded to earlier, SPI is a problematic metric. The SPI is the ratio between the EARNED Value and the Planned Value. At the end of a project , the EARNED Value equals the Planned Value, by definition.
10 As a project approaches its finish, the SPI begins to rise, regardless of the actual performance. Even late PROJECTS end with a perfect SPI. Unlike the SPI, EARNED SCHEDULE s SPIt accurately reflects time performance throughout a project s life cycle. Again, the test project illustrates the the time it completed, AgileES test had exceeded its planned finish by two sprints. Nonetheless, the SPI rose steadily from Sprint 10 onwards and ended at In contrast, the SPIt trended downwards from Sprint 11, ultimately finishing at .80. Given the project s finish date, the SPIt presents a more accurate picture of time performance than does the Robert Van De Velde 20134 Figure 2: project AgileEStestSPItvs. SPIIn summary, thereare practical reasons for applying EARNED SCHEDULE to AGILE PROJECTS . As shown bythe test project , AgileES offers new insight into burncharts, andit is more accurate thanEVM of AgileESis a good reason to use it, but practicalitydoes not prove deductionproves validity.