Transcription of Why EVM is not Good for Schedule Performance …
1 Why EVM Is Not good for Schedule Performance analyses (and how it could ) By Radenko Corovic, MBA Abstract Project Performance researchers are unanimous that the conventional EVM (Earned Value Management) is a very good tool to calculate project cost Performance . On the other hand, they have much more divergent opinions about the EVM capacity to provide reliable Schedule Performance indicators. Nevertheless, even though they recognise that the Schedule Performance indicator SPI is useless after the planned end of the project, most of them don t question its use and reliability over the first two thirds of the project.
2 My researches show that the Schedule Performance indicators are not reliable and are essentially erroneous over entire project life cycle for most commercial projects with a non-linear cumulative cost curve. But, getting the good Performance indicators is not enough. In analyzing what to do with EVM results, I propose a new Performance indicator which, in my opinion, is very significant for project managers. The main objective of project Performance analysis is to tell as how the project is performing related to three principal project factors: scope (size), cost and time. It has to indicate how our process of product development is performing, are we delivering our product (scope) on time and within planned costs.
3 We are practically measuring the effectiveness of our process by measuring its attributes, efforts (cost) and time [1]. We are measuring how are we delivering the product (instead in product scope, which is often very difficult to measure when the process is in progress, a product is expressed in its other attribute, its value, either planned or earned) comparing to the attributes of process costs (cost Performance analysis) and time ( Schedule Performance analysis)[1]. The fundamentals of EVM are based on this concept. EVM is supposed to indicate how our process (project) is performing by measuring and comparing the costs (actual costs-AC) and the time spent in order to produce a certain amount of a product (earned value-EV).
4 While the EVM works well when calculating cost Performance , it is much more different when we talk about Schedule Performance . Because of that, the cost Performance is not a subject of this analysis and the following article is focusing principally on time or Schedule Performance . EVM - Schedule Performance The EVM concept is graphically presented on two-dimension diagram. The planned as well as the earned value of the product is presented as a curve, for which each point is determined by the corresponding points on a vertical (cost) axis and on a horizontal (time) axis. Cost Performance indicators are based on the difference between earned value and actual costs at a given time.
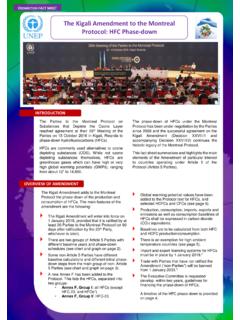
5 All this is projected on a vertical (cost) axis. Following this logic, time ( Schedule ) Performance should be calculated by measuring the value of product delivered at a given time (earned value) and by comparing this time to the time when this value was supposed (planned) to be delivered. The difference (called Schedule variance) should be presented on a horizontal (time) axis. But, for some reason, the conventional EVM calculates Schedule Performance by comparing EV delivered at a given time to the value planned to be delivered at the same time. Instead of calculating and expressing the results as the amount of time and presenting them on a horizontal (time) axis, the conventional EVM expresses the result as value and presents it on a vertical (cost) axis as we see in Figure 1.
6 Figure 1 Conventional EVM Approach This fundamental mistake is not just semantic. It has important implications not just on the unit of measure in which results are expressed (in measure of value instead of measure of time), but more importantly, it influences the Schedule Performance indicators in a way that make them practically useless and often even misleading. The first EVM indicator, the Schedule variance (SV), is expressed in product value and it is not of a great use for project managers. If you say to a project manager that his project is $500 000 late, you can expect a question: Yes, but how many months or days is it?
7 Classical EVM cannot provide a valid response. The second EVM indicator, the Schedule Performance indicator (SPI), is a ratio between EV and PV and at the end of the project, if the project has delivered all what was planned, EV and PV must be equal. This characteristic makes SPI useless after the planned end of the project because it tends to be 1 near to the project end. After the planned end of the project, planned value remains constant while the earned value is supposed to grow until the real end of the project. If your project is planned to be finished in 10 months, for example, and your EV after 10 months is 70%, you are obviously 30 % behind Schedule .
8 But, when you continue your project (you have to finish it eventually), and for some reason you do nothing for three months, your Schedule Performance will remain the same! At the end of the project your EV will be equal to your PV which, according to EVM, means that you have finished your project on time even though you are couple of months late. Great, isn t it? But I don t think that the client will share your enthusiasm. EVM Schedule Indicators Are Wrong This weakness of EVM is already very well explained by many authors (Fleming and Koppelman [2], Lipke[4], Henderson[3], Vandevoorde&Vanhoucke[8]) and even included in PMI Practice Standard of EVM[6].
9 Most of them argue that the EVM is not a reliable predictor of project duration and even recommend that EVM, relating to project Schedule Performance , should be used just as warning mechanism [2] and not as a real tool to analyze how the project is performing in time. Certain researchers maintain that SPI is good and reliable in first two thirds Budget (cost)of the project [3] [4] [8]) and it starts to be defective over the final third of a project's life cycle. All this could give the impression that the classical EVM, even though imperfect, could be used to calculate Schedule Performance over the first two thirds of a project.
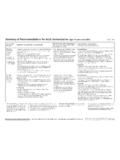
10 However, my research shows that the conventional EVM Schedule indicators are unreliable and deficient even in the early project stages for projects in which a cumulative cost curve is not linear (the vast majority of commercial projects are characterized by non-linear cumulative cost curves). To illustrate this, we will take one IT project for which cumulative costs are presented in Figure 2. The planned project duration is 10 months and the budget at completion (BAC) is $1M. I calculated the project Schedule Performance with conventional EVM indicators and I have obtained the following results: A) Calculated at June1st EV 1= $233,000 Schedule variance (SV1) = EV- PV = $-450,000 PV 1= $683,000 Schedule Performance Indicator (SPI 1) = EV/PV= Real delay 1 = months1 B) Calculated at September 1st EV 2= $ 775,000 Schedule variance (SV2) = EV- PV = $-183,000 PV 2= $ 958,000 Schedule Performance Indicator (SPI 2) = EV/PV= Real delay 2 = months Figure 2 EPM versus Earned Schedule 1 Real delay is calculated with Earned Schedule (ES) methodology which will be explained later.