Transcription of Effect of dehydration on blood tests - WordPress
1 Test tipsPRACTICAL DIABETES VOL. 34 NO. 5 COPYRIGHT 2017 JOHN WILEY & SONS 169In this third article in our Test tips series, Dr Muhammad Masood Ashraf and Dr Rustam Rea examine the effects of dehydration on all essential diabetes blood tests , and provide guidance on key practical points to is common in patients presenting to the acute admissions ward. The most common reasons include poor oral intake and fluid loss from: Gastrointestinal tract ( diar-rhoea, vomiting). Skin ( fever, burns). Urine ( glucosuria, diuretic therapy, diabetes insipidus, diabetic ketoacidosis).A reduction of the central circulating blood volume due to hypovolaemia accompanying dehydration results in a fall in cardiac filling pressure and stroke volume and, if uncompen-sated, a fall in cardiac output.
2 The body can compensate by moving water from the extravascular to the intravascular ,2 As a result of these fluid shifts, changes in electro-lytes and water concentrations in various body compartments occur which are reflected in many blood tests results. This is classically seen in patients with diabetic ketoacidosis and Hyperglycaemic Hyperosmolar State (previously HONK). The clinical and biochemical features of dehydration3 are summa-rised in Box of dehydration on haemoglobin, haematocrit and HbA1cBoth haemoglobin and haematocrit increase in a dehydrated ,4 Hiroshi Nose1 and colleagues induced dehydration in 10 subjects by exercise and checked haemoglobin (Hb), haematocrit (Hct), Na, K+, Cl, and plasma osmolality at 0 minutes, 30 minutes and 60 minutes after exer-cise.
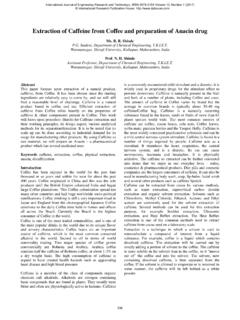
3 Figure 1 shows the change in Hct, Hb, and plasma solids before and after dehydration . Immediately after exercise, these increased from to , to , and to , respectively. The signifi-cant differences observed before and after dehydration were maintained for the next 60 minutes. HbA1c is the measure of glycae-mic status of an individual over the last three It is formed by a non-enzymatic reaction which occurs between glucose and the N-end of the beta There is very little literature available on data search to suggest that dehydration directly affects HbA1c. However, a rise in urea level as a result of dehy-dration can alter the HbA1c test results depending on the Effect of dehydration on blood testsVignetteA 75-year-old lady was admitted with history of cough, high-grade fever and reduced oral intake for four days.
4 She also complained of reduced urine output. Her past medical history included type 2 diabetes, hypertension, migraine, gastro-oesophageal reflux disease, and a non-functioning pituitary microadenoma. Her regular medication included hydrochlorothiazide, amlodipine, metformin and omeprazole. She was found to have dry mucous membranes, temperature , and BP 90/60mmHg. Chest examination revealed L-sided basal crackles. Her blood tests on admission and after starting IV fluid replacement are summarised in the Table Effect of dehydration on blood tests , highlighted in darker blue tint in the above Table, indicates that haemoglobin, haematocrit, urea/creatinine, Na+/K+, glucose and protein levels change significantly with improvement in the hydration status of the patient. A number of questions arise from these data, and these are: Is the poor glycaemic control a marker of dehydration or uncontrolled diabetes?
5 Is the drop in haemoglobin due to blood loss? Do the renal function tests suggest dehydration as a primary cause of acute kidney injury? Does the drop in albumin indicate deterioration in the liver s synthetic function?Tests9 March11 March13 MarchHb (g/L) 10912 + (mmol/L)160156150K (mmol/L) (mmol/L) ( mol/L)263145133 Glucose (mmol/L)19119 HbA1c (mmol/mol)75 Total proteins (g/L)60 48 Albumin (g/L)29 23 ALT (IU/L)24 23 ALP (IU/L)132 126 Total bilirubin ( mol/L)8 10 Total globulin (g/L)31 28 Test tipsEffect of dehydration on blood tests170 PRACTICAL DIABETES VOL. 34 NO. 5 COPYRIGHT 2017 JOHN WILEY & SONSOne study showed that in patients with uraemia, HbA1c measured by ion exchange chromatography was significantly elevated, but this was not correlated with the degree of glucose This was due to the excessive amount of cyanate derived from the urea, which causes carbamylation at the N-terminal valine residue.
6 This carbamylated haemoglobin (carbHb) results in an increase in the HbA1 (a + b) and, hence, the increased levels of ,8 However, newer ion-ex-change HPLC assay methods show improved separation of the HbA1c fraction from other haemoglobin fractions and therefore no interfer-ence from Effect of dehydration on CBG measurementsHypotension as a result of dehydra-tion results in decrease in perfusion and increase in glucose utilisation in the local tissue leading to false low results of capillary blood glucose (CBG) tests . One study assessed the validity of the CBG measurements in the hypotensive, critically-ill patients. Capillary glucose values were signifi-cantly lower than those obtained from testing venous blood on the reagent strips and also lower than laboratory glucose measurements.
7 Capillary glu-cose values in the hypotensive group were 33% lower than venous labora-tory glucose values, and were signifi-cantly lower than the values obtained in the normotensive of dehydration on blood glucoseOne study has looked at the Effect of dehydration in frogs and demon-strated that dehydration can increase blood glucose The rise in glu-cose was found to be out of proportion to changes in metabolite concentra-tions that could be due to passive concentration of the plasma (haemo-concentration) as a result of dehydra-tion. Glucose was significantly elevated even in of dehydrated frogs and rose progressively to a final level times higher than controls in 50% of dehydrated frogs. Another study showed an increase in hepatic glucose production, with increased plasma glucose levels dur-ing hyperosmolality which can be caused by The very high levels of venous glucose seen in patients with Hyperglycaemic Hyper-osmolar State often resolve rapidly with rehydration alone without the need for insulin.
8 This would suggest a significant Effect of dehydration on venous glucose of dehydration on renal function testsDehydration has multiple effects on the kidney. The loss of body water leads to an increase in serum osmo-lality and activation of vasopressin which results in urinary This can be seen clearly in the above given Vignette. Nose1 and colleagues also demon-strated sustained effects on plasma electrolyte concentration before and after dehydration (Figure 2). However, there is an exception in the case of patients with cranial diabetes insipidus (CDI). Dehydrated patients usually present with an elevated serum urea level, owing in part to increased renal reabsorption of urea mediated by antidiuretic hormone (ADH). Serum urea values fall in patients with ADH deficiency (CDI) and this fact can be used to distinguish patients dehydrated because of CDI from those with usual hypertonic Clinical features of dehydration Dry mucus membrane Dry skin Reduced skin turgor Reduced axillary sweating Orthostatic hypotension Tachycardia and hypotension (indicates shock) Cognitive impairment Reduced urinary output (< is suggestive of acute kidney injury) Concentrated urine and high osmolalityBiochemical changes Raised serum urea Raised creatinine Reduced estimated glomerular filtration rate (eGFR) Increased urea:creatinine ratio Hypernatraemia (loss of water greater than salt loss) Raised serum or urine osmolality Raised urine specific gravityBox 1.
9 Summary of the clinical and biochemical features of dehydration3 Figure 1. Haematocrit (Hct), haemoglobin (Hb) concentration, and plasma (Pl) solids are shown as means SE of 10 subjects before (C) and at 0, 30, and 60 minutes after dehydration . Significant differences were observed for all variables between control and dehydrated conditions (0, 30, and 60 minutes). There were significant differences between 0 minutes and the other 2 dehydrated conditions (30 and 60 minutes)Hct (%)Hb (g/dl)Pl solid (g/dl)45401615141098C 0 30 60 Time (minutes)Test tipsEffect of dehydration on blood testsPRACTICAL DIABETES VOL. 34 NO. 5 COPYRIGHT 2017 JOHN WILEY & SONS 171dehydration and intact ADH secre-tion. In one study, the mean serum urea level was in the CDI group and in the patients without CDI, while the mean serum sodium level was 155mmol/L in both Effect of dehydration on lipid profileThe Effect of dehydration on lipid profile has been investigated in fast-ing Subjects were fasted, initially with no fluid replacement and then with salt and water supple-mentation.
10 Subjects who had fasted with no fluids had a higher total serum cholesterol, HDL cholesterol, LDL cholesterol, apolipoprotein A-1, and apolipoprotein B, compared to subjects who had fasted with prior fluid and salt replacement. Effect of dehydration on liver function testsThe above given Vignette demon-strates a significant difference in serum total proteins and albumin levels in a dehydrated patient, before and after hydration with intravenous fluids. However, bilirubin and liver enzymes levels remained unchanged, indicating that changes in protein levels were essentially due to hydra-tion status rather than liver abnor-mality per should take the hydration status of the patient into account before interpreting the laboratory results. Before routine blood tests , patients should avoid unnecessary physical activity, avoid hot dry envi-ronments, ensure adequate intake of water, and avoid diuretic sub-stances such as Muhammad Masood Ashraf, MRCP, ST4, Diabetes and Endocrinology, Stoke Mandeville Hospital, Aylesbury, UKDr Rustam Rea, DM, FRCP, Consultant Physician in Diabetes and General Medicine, Oxford Centre for Diabetes, Endocrinology and Metabolism, Oxford University Hospitals NHS Foundation Trust, Oxford, UKCorrespondence to: Dr Rustam Rea, email: Institute of Medicine (US) Committee on Military Nutrition Research.