Transcription of Determination of Caffeine in Coffee Products According to …
1 Determination of Caffeine in Coffee Products According to DIN 20481. Application Note Food Testing & Agriculture Food Authenticity Author Abstract Edgar Naegele This Application Note demonstrates the Determination of Caffeine in Coffee Agilent Technologies, Inc. Products According to DIN 20481, which is part of a series of quality control Waldbronn, Germany measurements of Coffee Products . The performance of the system is shown for linearity, retention time, and area precision as well as accuracy. The performance is also shown on solvent saver columns with reduced id. Introduction Today, Coffee is the second most valuable product (besides crude oil) exported from developing countries, with a trading volume of approximately 22 billion US $. In 2007, the world Coffee production was approximately 7,742,675 tons, with Brasilia as the largest producer of approximately 28 %. On the consumer side, the USA has the highest total consumption and Finland the highest consumption per person.
2 One of the main ingredients of Coffee is the alkaloid Caffeine , with approximately 80 120 mg per cup. Caffeine is responsible for the stimulating effect of Coffee . Decaffeinated Coffee is produced in large amounts by extraction of the Caffeine from green Coffee beans with hot water, organic solvents, or supercritical carbon dioxide1. Decaffeinated Coffee must contain less than % caffeine2. In the European Union, only beverages that do not typically contain Caffeine , for example energy drinks, must be labeled with the amount of Caffeine the beverages contain. The measurement of Caffeine in Coffee Products is standardized in the DIN ISO. regulations3. Besides Caffeine , other important compounds inherent in Coffee have to be controlled like chlorogenic acids4,5, 16-O-methyl cafestol6,7 and contaminants such as mycotoxins8,9. Verified for Agilent 1260 Infinityty II LC. Experimental HPLC method Equipment Parameter Value Agilent 1260 Infinity LC System: Solvents A) Water B) Methanol Agilent 1260 Infinity Binary Pump Flow rate mL/min with Column 1, (G1312B) with external degasser mL/min with Column 2 and Column 3, mL/min with Column 3.
3 (G1322A). Elution conditions Isocratic, 25 % methanol Stop time 12 minutes Agilent 1260 Infinity Standard Injection volume 10 L with Column 1, Autosampler (G1329B) with L with Column 2, Sample Thermostat (G1330B) L with Column 3. Needle wash In vial with methanol Agilent 1260 Infinity Thermostatted Column temperature 25 C. Column Compartment (G1316A) Detection 272 nm Bandwidth 4 nm; Reference: 360 nm Agilent 1260 Infinity Diode Array Bandwidth 16 nm Detector (G4212B) with a 10 mm Data rate 10 Hz flow cell (G4212-60008). Standards the decaffeinated product was used Software directly for injection and the extract from Caffeine stock solution: 200 mg Caffeine Agilent OpenLAB CDS ChemStation (water free) was dissolved in 500 mL regular Coffee after a 1:10 dilution. Edition for LC & LC/MS Systems, warm water in a 1-L volumetric flask Rev. and filled with water to 1 L after cooling Results and Discussion down to room temperature.
4 A 1/10 and The content of Caffeine in Coffee initially a 1/50 dilution was used as starting depends on the biological Coffee plant Columns concentration for the calibrations. species. For instance, the species Coffea 1. Agilent ZORBAX Eclipse Plus, arabica contains about half of the species 150 mm, 5 m Sample preparation Coffea robusta, the first is approximately (p/n 959993-902) 60 % of the world production and the Instant Coffee ( g) and 5 g MgO were 2. Agilent Poroshell 120 EC-C18, combined in 200 mL water at 90 C second 36 %. For the measurement of 150 mm, m and stirred for 20 minutes at 90 C in the content of Caffeine in regular Coffee (p/n 693975-302) a water bath. After removal from the and decaffeinated Coffee Products , two water bath and cooling down to room calibrations in the typical range were 3. Agilent Poroshell 120 EC-C18, temperature, a part of the liquid was created.
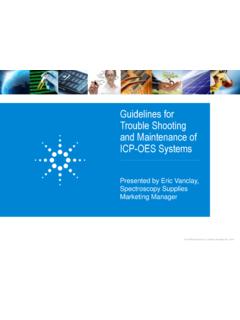
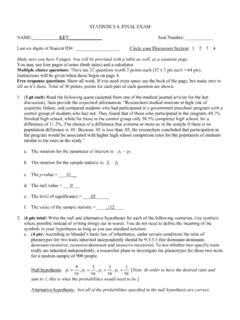
5 For regular Coffee , the calibration 50 mm, m filtrated through a cellulose syringe filter was done from mg/L to 20 mg/L and (p/n 699975-302) (Agilent Captiva Premium Syringe Filter, for decaffeinated and Caffeine -reduced Regenerated Cellulose, m, 25 mm, Coffee Products , the calibration was done Chemicals p/n 5190 5111). The filtered extract from from mg/L to 4 mg/L (Figure 1). All Chemicals were purchased from Sigma/Aldrich, Germany. Methanol was Area Area purchased from Merck, Germany. Fresh 600 A 5 120 B 6. ultrapure water was obtained from a 500 Correlation: 100 Correlation: Milli-Q Integral system equipped with 400 80. LC-Pak Polisher and a m membrane 300 4. 60. 5. point-of-use cartridge (Millipak). Regular 200 3 40 4. and decaffeinated instant Coffee was 100 1. 2 20 1 2 3. purchased from a local super market. 0 0. 0 5 10 15 20 0 1 2 3 4. Amount (mg/L) Amount (mg/L).
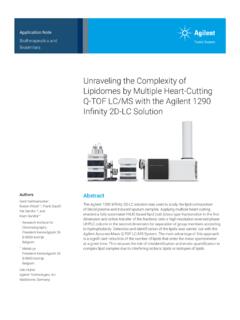
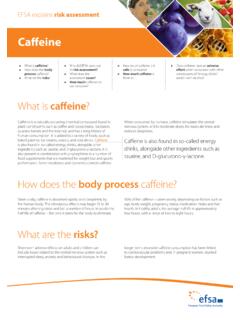
6 Figure 1. Calibration curves for Caffeine , A) calibration for the concentration range 20 mg/L. B) Calibration for the concentration range 4 mg/L. 2. Both calibrations show excellent linearity. Caffeine The limit of quantification (LOQ) was mAU A found at mg/L and the limit of mg/L. 50. detection (LOD) at mg/L. Under the chosen HPLC conditions, Caffeine O CH3. eluted at minutes and an overlay of 40. H3C. the injected concentrations from each N. N. calibration shows good peak shapes for 30. mg/L. all concentrations and retention time O N N. conformance (Figure 2). 20. CH3. To demonstrate the performance, a mg/L. 10. statistical evaluation was done by mg/L. multiple injection (n = 10) of the Caffeine mg/L. 0. concentration level at 10 mg/L for the 4 5 6 7 8 9 10 min higher concentration calibration and Caffeine at 1 mg/L for the lower level Caffeine mAU concentration calibration (Table 1).
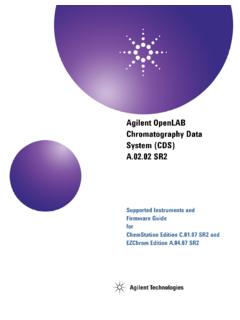
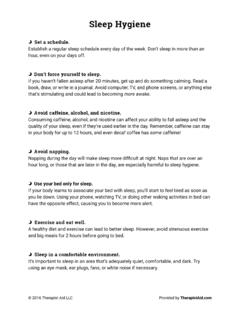
7 B mg/L. 10. 8. 6. mg/L. 4. mg/L. 2. mg/L. mg/L. mg/L. 0. 4 5 6 7 8 9 10 min Figure 2. Overlay of Caffeine peaks of different concentrations used as calibration levels. A) Caffeine concentrations, 20 mg/L. B) Caffeine concentrations 4 mg/L. Table 1. Performance data measured for 10 mg/L and 1mg/L of Caffeine with the Agilent ZORBAX. Eclipse Plus C18, 150 mm column as well as concentration precision and accuracy. Parameter Value Column Agilent ZORBAX Eclipse Plus C18, 150 mm Caffeine 10 mg/L Caffeine 1 mg/L. (min) RSD (%) area RSD (%) Calibration mg/L mg/L. R2 LOD mg/L. LOQ mg/L. Carryover from mg/L - Concentration precision % at mg/L. Concentration accuracy % at mg/L. 3. The retention time RSD and area RSD mAU A Caffeine 20 mg/L were at % and % for the lower 50. 40. concentration, respectively. For the 30. Determination of carryover, the highest 20. 10. concentration used from the calibration 0.
8 Was injected and followed by a blank 2 4 6 8 10 12 14 min injection. In this blank, no Caffeine mAU B Caffeine mg/L, LQQ. carryover could be detected (Figure 3). The concentration precision and accuracy were measured for repeated injection 0. (n = 10) of 12 mg/L Caffeine . The 2 4 6 8 10 12 14 min precision was determined to be %. mAU C Blank and concentration accuracy was found to be %. The analysis According to the description in the DIN ISO Norm was done under conventional HPLC conditions at a 2 4 6 8 10 12 14 min flow rate of 1 mL/min with a id Figure 3. Determination of carryover of Caffeine for the maximum concentration used. A) Maximum column. To save solvent and costs, the concentration of Caffeine at 20 mg/L. B) Lowest level of Caffeine used for calibration at mg/L. described calibration and statistical (LOQ = mg/L), as comparison. C) Blank injection following maximum Caffeine concentration evaluation was repeated with a solvent injection showing no carry over.
9 Saver column of the same length but with a id at a flow rate of mL/min Table 2. Performance data measured for 10 mg/L and 1 mg/L of Caffeine with the Agilent Poroshell 120. (Table 2). Retention time and area RSD as EC-C18, 150 mm column as well as concentration precision and accuracy. well as linearity were in the same range Parameter Value as found for the id column. In contrast to the conventional columns, a Column Agilent Poroshell 120 EC-C18, 150 mm, lower LOQ and LOD were found with the Caffeine 10 mg/L Caffeine 1 mg/L. solvent saver column at mg/L and (min) mg/L, respectively. This effect was RSD (%) due to the higher separation power of area RSD (%) this type of column with its m fused Calibration mg/L mg/L. core shell particles delivering higher R2 and sharper peaks yielding improved signal to-noise performance. LOD mg/L. LOQ mg/L. Carryover from mg/L - Concentration precision % at mg/L.
10 Concentration accuracy % at mg/L. 4. Finally, a sample of regular instant Coffee mAU. and decaffeinated instant Coffee were 120. analyzed (Figures 4 and 5). A content based on used instant Coffee granules of 100. less than % Caffeine was found for the decaffeinated product (Figure 4). This 80. is in accordance with the regulation for decaffeinated Coffee Products to be below 60. % Caffeine . The regular Coffee product contained approximately 2 % of Caffeine 40. based on the used instant Coffee granules (Figure 5). 20. 0. 2 4 6 8 min Figure 4. Determination of Caffeine in decaffeinated instant Coffee . mg/L from g in 200 mL yields mg/g instant Coffee granules, < %. mAU 14. 12. 10. 8. 6. 4. 2. 0. 2 4 6 8 10 min Figure 5. Determination of Caffeine in regular instant Coffee . mg/L from g in 200 mL. (1:10 dilution) yields mg/g instant Coffee powder, approximately 2 %. 5. To improve productivity, the 150 mm mAU.