Transcription of EMI Design Guidelines for USB Components
1 EMI Design Guidelines for USB Components 1. Disclaimer This document is provided "as is" with no warranties whatsoever, including any warranty of merchantability, fitness for any particular purpose, or any warranty otherwise arising out of proposal, specification, or sample. No license, express or implied, by estoppel or otherwise, to any other intellectual property rights is granted herein. Intel disclaims all liability, including liability for infringement of any proprietary rights, relating to implementation of information in this document. 2. Introduction These developers notes describe electrical and mechanical Guidelines for the Design of EMC compatible USB devices.
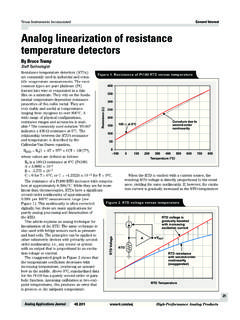
2 A description of EMI test procedures is given, followed by a brief review of the theory behind EMI phenomena. Design Guidelines for electrical, PC layout and mechanical considerations are then presented for low and full speed devices, USB cables, and hubs. 3. EMI Testing Procedures Current FCC regulations require that class B computing devices meet specified maximum levels for both radiated and conducted EMI. Radiated EMI covers the frequency range from 30 Mhz to Ghz. Figure 1. illustrates the test setup for radiated EMI testing. The equipment under test (EUT) is placed on a rotating table approximately meter above a conductive floor.
3 At the distance of 10 meters, an antenna is placed. The antenna can be raised and lowered. The conductive floor provides a uniform and EMI. reflective surface. The radiated EMI test consists of sweeping from 30 Mhz to Ghz while the EUT is operating. If a spectral peak is within about 15 dB of the limit, it is maximized by means or rotating the EUT, and raising/lowering the antenna. Then the peak value is recorded. Typically, two different antenna types are required, one for below 250 Mhz, and one for above. If the peak falls within about 5 dB of the limit, a quasi peak mode, which averages over a time of many milliseconds, may be used.
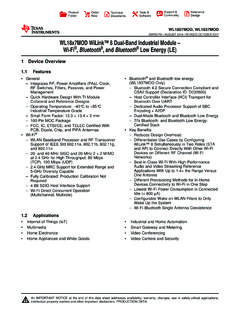
4 If the signal has a high peak to average ratio, then quasi peak measurements will show improvement. Quasi peak measurements are not used at other times because of the length of time required to make each measurement. Spectrum EUT. Analyzer Conductive floor 10 M. Draft 1. Figure 1: Radiated EMI Test Setup Conducted EMI covers the 450 Khz to 30 Mhz range. This test is conducted in a shielded room with the EUT operating. The conducted EMI test measures the amount of EMI that is conducted via the power cable. A line isolation stabilization network (LISN) is interposed between the EUT and the spectrum analyzer. EUT. EUT. Sp Analyzer LISN.
5 Figure 2: Conducted EMI Test Setup The LISN is a passive network which improves the repeatability of conducted measurements by presenting a 50 load impedance to the noise signals of the EUT and by filtering noise from other non EUT sources. The LISN also contains switches to permit noise to be measured between each power conductor and ground. In addition to radiated and conducted EMI tests, there is another emerging standard, already in place in Europe, that requires computing devices to be tested for ESD susceptibility. This test requires that a device must tolerate ESD events and remain operational without user intervention.
6 The test apparatus is diagrammed in Figure 3. Draft 2. EUT. Figure 3: EMI Susceptibility Test In this test a human body static electricity model is simulated by a high voltage gun that produces up to 8. kV that is discharged either to a conducting surface on which the EUT is operating or to conductive elements of the EUT itself (example: connectors, chassis). The EUT is permitted to experience transient errors, but it must continue to operate without user intervention. For the types of devices utilizing USB the most difficult test to pass is usually the radiated EMI test. For this reason the analysis that follows focuses on analyzing and minimizing radiated EMI.
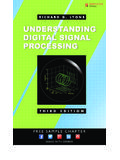
7 4. Factors Influencing EMI. EMI arises due to the transfer of energy from one source conducting RF currents to other radiating or conducting elements such as cables or power cords. One of the more troublesome source of EMI is the system clock which is distributed to multiple destinations and has a fast rise time. The following analysis is performed on a continuous duty cycle, symmetric trapezoidal waveform. This case represents a worst case waveform; other waveforms with lower edge density will generate correspondingly less energy and will spread that energy over a greater number of harmonics. Amplitude A. A/2. r Time T0.
8 Figure 4: Periodic Trapezoidal Waveform There are two significant parameters displayed in Figure 4, the period T 0 and the risetime r. The spectral envelope of the above waveform can be obtained via Fourier analysis, and can be represented as shown in Figure 5. The waveform shown in Figure 4 yields a spectral envelope with two break points. The first Draft 3. corresponds to 1/ which, for a 50% duty cycle waveform, corresponds to one half the period T0. The second breakpoint corresponds to 1/ r, or the reciprocal of risetime. Amplitude slope = 6 dB/decade slope = 12 dB/decade 1 1 Frequency r Frequency Risetime Figure 5: Spectral Envelope of Trapezoidal Waveform At frequencies above 1/ r the amplitude of spectral Components falls off at 12 dB/decade or the reciprocal of the square of the risetime.
9 It is desirable, therefore, to use as slow risetime signals as timing margins permit. A rule of thumb in digital Design requires that the bandwidth of a digital signal include the first ten harmonics. More than 95 percent of the energy of a trapezoidal waveform is contained in the first 10. harmonics. Consider the example of low speed USB signaling. By specifying a minimum risetime of 75 nsec the 6 dB. to 12 dB break point is located at Mhz. All harmonics above this value will be rolled off at 12 dB per decade. From a practical point of view this means that there is no appreciable energy above the 30 Mhz lower limit of FCC B radiated testing.
10 Now consider the same signaling rate but with a 10 ns risetime. This would, of course, represent a violation of the USB specification. Such a signal has a break frequency of 32 Mhz, and this signal would have significant spectral Components above 30 Mhz. Field testing of low speed USB signaling has confirmed the sensitivity of radiated EMI to risetime and led to specifying the 75. - 300 ns risetime limits. The second factor influencing EMI is the mode of propagation for undesirable signals. Signals may propagate via either differential mode or common mode. In the differential mode signals are assumed to exist in pairs with current flowing in equal and opposite directions.