Transcription of Enzyme Action: Testing Catalase Activity (Method …
1 Computer 2 Advanced Biology with Vernier 2 - 1 (O2) Enzyme action : Testing Catalase Activity (Method 1 O2 Gas Sensor) Many organisms can decompose hydrogen peroxide (H2O2) enzymatically. enzymes are globular proteins, responsible for most of the chemical activities of living organisms.
2 They act as catalysts, substances that speed up chemical reactions without being destroyed or altered during the process. enzymes are extremely efficient and may be used over and over again. One Enzyme may catalyze thousands of reactions every second. Both the temperature and the pH at which enzymes function are extremely important. Most organisms have a preferred temperature range in which they survive, and their enzymes most likely function best within that temperature range. If the environment of the Enzyme is too acidic or too basic, the Enzyme may irreversibly denature, or unravel, until it no longer has the shape necessary for proper functioning.
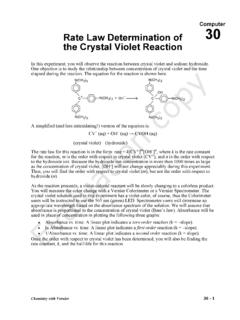
3 H2O2 is toxic to most living organisms. Many organisms are capable of enzymatically destroying the H2O2 before it can do much damage. H2O2 can be converted to oxygen and water, as follows: 2 H2O2 2 H2O + O2 Although this reaction occurs spontaneously, enzymes increase the rate considerably. At least two different enzymes are known to catalyze this reaction: Catalase , found in animals and protists, and peroxidase, found in plants. A great deal can be learned about enzymes by studying the rates of Enzyme -catalyzed reactions. The rate of a chemical reaction may be studied in a number of ways including: measuring the rate of appearance of a product (in this case, O2, which is given off as a gas) measuring the rate of disappearance of substrate (in this case, H2O2) measuring the pressure of the product as it appears (in this case, O2).
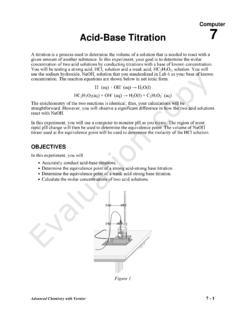
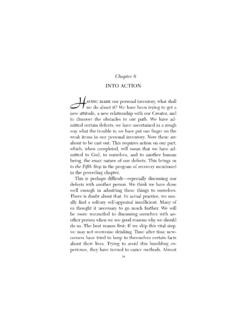
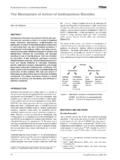
4 In this experiment, you will measure the rate of Enzyme Activity under various conditions, such as different Enzyme concentrations, pH values, and temperatures. It is possible to measure the concentration of oxygen gas formed as H2O2 is destroyed using an O2 Gas Sensor. If a plot is made, it may appear similar to the graph shown. At the start of the reaction, there is no product, and the concentration is the same as the atmosphere. After a short time, oxygen accumulates at a rather constant rate. The slope of the curve at this initial time is constant and is called the initial rate.
5 As the peroxide is destroyed, less of it is available to react and the O2 is produced at lower rates. When no more peroxide is left, O2 is no longer produced. Evaluation copyComputer 2 2 - 2 (O2) Advanced Biology with Vernier OBJECTIVES In this experiment, you will Use a computer and an Oxygen Gas Sensor to measure the production of oxygen gas as hydrogen peroxide is destroyed by the Enzyme Catalase or peroxidase at various Enzyme concentrations. Measure and compare the initial rates of reaction for this Enzyme when different concentrations of Enzyme react with H2O2.
6 Measure the production of oxygen gas as hydrogen peroxide is destroyed by the Enzyme Catalase or peroxidase at various temperatures. Measure and compare the initial rates of reaction for the Enzyme at each temperature. Measure the production of oxygen gas as hydrogen peroxide is destroyed by the Enzyme Catalase or peroxidase at various pH values. Measure and compare the initial rates of reaction for the Enzyme at each pH value. MATERIALS Vernier computer interface pH buffers computer Enzyme suspension Logger Pro three 18 150 mm test tubes Vernier O2 Gas Sensor test tube rack 10 mL graduated cylinder ice 400 mL beaker thermometer 250 mL Nalgene bottle three dropper pipettes H2O2 PROCEDURE 1.
7 Obtain and wear goggles. 2. Connect the Oxygen Gas Sensor to the computer interface. Prepare the computer for data collection by opening the file 02 (O2) Enzyme from the Advanced Biology with Vernier folder of Logger Pro. Part I Testing the Effect of Enzyme Concentration 3. Place three test tubes in a rack and label them 1, 2, and 3. Fill each test tube with 5 mL of H2O2 and 5 mL of water. 4. Initiate the Enzyme catalyzed reaction. a. Using a clean dropper pipette, add 5 drops of Enzyme suspension to test tube 1. b. Begin timing with a stopwatch or clock.
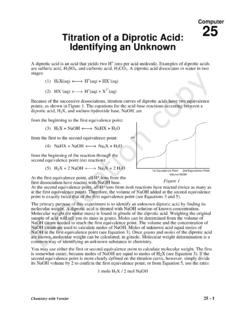
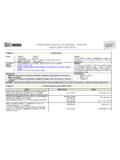
8 C. Cover the opening of the test tube with a finger and gently invert the test tube two times. d. Pour the contents of the test tube into a clean 250 mL Nalgene bottle. e. Place the O2 Gas Sensor into the bottle as shown in Figure 1. Gently push the sensor down into the bottle until it stops. The sensor is designed to seal the bottle without the need for unnecessary force. f. When 30 seconds has passed, click to begin data collection. Enzyme action : Testing Catalase Activity (O2) Advanced Biology with Vernier 2 - 3 (O2) Figure 1 5. When data collection has finished, remove the O2 gas sensor from the Nalgene bottle.
9 Rinse the bottle with water and dry with a paper towel. 6. Move your data to a stored run. To do this, choose Store Latest Run from the Experiment menu. 7. Collect data for test tubes 2 and 3: Add 10 drops of the Enzyme solution to test tube 2. Repeat Steps 4 6. Add 20 drops of the Enzyme solution to test tube 3. Repeat Steps 4 5. 8. Using the mouse, select the initial linear region of your data on the graph. Click on the Linear Fit button, . Click and a best-fit linear regression line will be shown for each run selected. In your data table, record the value of the slope, m, for each of the three solutions.
10 (The linear regression statistics are displayed in a floating box for each of the data sets.) 9. To print a graph of concentration vs. volume showing all three data runs: a. Label all three curves by choosing Text Annotation from the Insert menu, and typing 5 Drops (or 10 Drops, or 20 Drops) in the edit box. Then drag each box to a position near its respective curve. Adjust the position of the arrow head. b. Print a copy of the graph, with all three data sets and the regression lines displayed. Enter your name(s) and the number of copies of the graph you want.