Transcription of (Total Dissolved Solids)
1 Computer 13 Earth Science with Vernier 13 - 1 water quality TDS ( total Dissolved Solids) Solids are found in streams in two forms, suspended and Dissolved . Suspended solids include silt, stirred-up bottom sediment, decaying plant matter, or sewage-treatment effluent. Suspended solids will not pass through a filter, whereas Dissolved solids will. total Dissolved solids, or TDS, can be determined by using a Vernier Conductivity Probe to determine the ability of the Dissolved salts and their resulting ions to conduct an electrical current. The conductivity is then converted to TDS. The TDS concentration in a body of water is affected by many different factors. A high concentration of Dissolved ions is not, by itself, an indication that a stream is polluted or unhealthy.
2 It is normal for streams to dissolve and accumulate fairly high concentrations of ions from the minerals in the rocks and soils over which they flow. If these deposits contain salts (sodium chloride or potassium chloride) or limestone (calcium carbonate), then significant concentrations of ions will result. TDS is sometimes used as a watchdog environmental test. Any change in the ionic composition between testing sites in a stream can quickly be detected using a Conductivity Probe. TDS values will change when ions are introduced to water from salts, acids, bases, hard- water minerals, or soluble gases that ionize in solution. However, the test described here will not tell you the specific ion responsible for the increase or decrease in TDS. It simply give a general indication of the level of Dissolved solids in the stream or lake. There are many possible human induced sources of ions that may contribute to elevated TDS readings.
3 Fertilizers from fields and lawns can add a variety of ions to a stream. Increases in TDS can also result from runoff from roads that have been salted in the winter. Organic matter from wastewater treatment plants may contribute higher levels of nitrate or phosphate ions. Treated wastewater may also have higher TDS readings than surrounding streams if urban drinking water has been highly chlorinated. Irrigation water that is returned to a stream will often have higher concentrations of sodium or chloride ions. Acidic rainwater, with Dissolved gases like CO2, NO2, or SO2, often yields elevated H+ ion concentrations. If TDS levels are high, especially due to Dissolved salts, many forms of aquatic life are affected. The salts act to dehydrate the skin of animals. High concentrations of Dissolved solids can add a laxative effect to water or cause the water to have an unpleasant mineral taste.
4 It is also possible for Dissolved ions to affect the pH of a body of water , which in turn may influence the health of aquatic life. If high TDS readings are due to hard- water ions, then soaps may be less effective, or significant boiler plating may occur in heating pipes. Sources of total Dissolved Solids Hard- water Ions - Ca2+ - Mg2+ - HCO3 Fertilizer in agricultural runoff - NH4+ - NO3 - PO43 - SO42 Urban runoff - Na+ - Cl Salinity from tidal mixing, minerals, or returned irrigation water - Na+ - K+ - Cl Acidic rainfall - H+ - NO3 - SO32 , SO42 Evaluation copyComputer 13 13 - 2 Earth Science with Vernier Expected Levels TDS values in lakes and streams are typically found to be in the range of 50 to 250 mg/L. In areas of especially hard water or high salinity, TDS values may be as high as 500 mg/L. Drinking water will tend to be 25 to 500 mg/L TDS.
5 United States Drinking water Standards1 include a recommendation that TDS in drinking water should not exceed 500 mg/L TDS. Fresh distilled water , by comparison, will usually have a conductivity of to mg/L TDS. Table 1: TDS in Selected Rivers Site SeasonTDS (mg/L) Season TDS (mg/L) Rio Grande River, El Paso, TX Spring 510 Fall 610 Mississippi River, Memphis, TN Spring 133 Fall 220 Sacramento River, Keswick, CA Spring 71 Fall 60 Ohio River, Benwood, WV Spring 300 Fall 143 Hudson River, Poughkeepsie, NY Spring 90 Fall 119 MATERIALS computer wash bottle with distilled water Vernier computer interface tissues or paper towels Logger Pro small paper or plastic cup (optional) Vernier Conductivity Probe 50 mg/L TDS standard solution (optional) 500 mg/L TDS standard solution Collection and Storage of Samples 1.
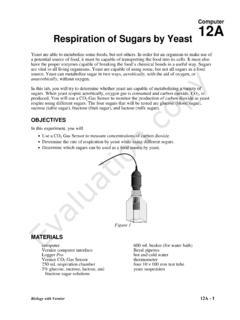
6 This test can be conducted on site or in the lab. A 100 mL water sample is required. 2. It is important to obtain the water sample from below the surface of the water as far away from shore as is safe. If suitable areas of the stream appear to be unreachable, samplers consisting of a rod and container can be constructed for collection. 3. If the testing cannot be conducted within a few hours, place the samples in an ice chest or a refrigerator. PROCEDURE 1. Position the computer safely away from the water . 2. Prepare the Conductivity Probe for data collection. a. Connect the Conductivity Probe to the Vernier computer interface. b. Set the switch on the probe box to the 0 2000 S/cm range (2000 S/cm = 1000 mg/L TDS). 1 Established by 1986 Amendments to the Safe Drinking water Act water quality TDS Earth Science with Vernier 13 - 3 3.
7 Prepare the computer for data collection by opening the file 13 WQ TDS in the Earth Science with Vernier folder. 4. You are now ready to calibrate the Conductivity Probe. If your instructor directs you to use the calibration stored in the experiment file, then proceed to Step 5. If your instructor directs you to perform a new calibration for the Conductivity Probe, follow this procedure: First Calibration Point a. Choose Calibrate ` CH1: Conductivity (mg/L) from the Experiment menu and then click . b. Perform the first calibration point with the probe in the air. c. Type 0 in the edit box. d. When the displayed voltage reading for Reading 1 stabilizes, click . Second Calibration Point e. Place the Conductivity Probe into the 500 mg/L TDS standard solution. The hole near the tip of the probe should be covered completely. f. Type 500 (the concentration in mg/L TDS) in the edit box.
8 G. When the displayed voltage reading for Reading 2 stabilizes, click , then click . 5. You are now ready to collect TDS concentration data. a. Rinse the probe tip with distilled water . b. Place the tip of the probe into the stream, or into a cup with sample water from the stream. The hole near the tip of the probe should be completely covered. c. If the TDS value appears stable, simply record it on the Data & Calculations sheet and proceed to Step 7. 6. If the TDS value displayed in the meter is fluctuating, determine the mean (or average) value. a. Click to begin a 10 second sampling run. Important: Leave the probe tip submerged for the 10 seconds that data is being collected. b. When the sampling run is complete, click on the Statistics button, , to display the statistics box on the graph. c. Record the mean TDS value on the Data & Calculations sheet.
9 7. Return to Step 5 to obtain a second reading. 8. Calculate the average TDS readings and record it on the Data & Calculations sheet. Computer 13 13 - 4 Earth Science with Vernier DATA & CALCULATIONS TDS: total Dissolved Solids Stream or lake: _____ Date: _____ Site name: _____ Time of day: _____ Student name: _____ Student name: _____ Student name: _____ Student name: _____ Reading TDS (mg/L) 1 2 Average Field Observations ( , weather, geography, vegetation along stream) _____ _____ _____ _____ Test Completed: _____ Date: _____ Vernier Lab Safety Instructions Disclaimer THIS IS AN EVALUATION COPY OF THE VERNIER STUDENT LAB. This copy does not include: z Safety information z Essential instructor background information z Directions for preparing solutions z Important tips for successfully doing these labs The complete Earth Science with Vernier lab manual includes 33 labs, 6 projects, and essential teacher information.
10 The full lab book is available for purchase at: Vernier Software & Technology 13979 Millikan Way Beaverton, OR 97005-2886 Toll Free (888) 837-6437 (503) 277-2299 FAX (503) 277-2440