Transcription of EXPLORING DATA AND STATISTICS Modeling with 14
1 Page 1 of 2862 Chapter 14 Trigonometric Graphs, Identities, and EquationsModeling withTrigonometric FunctionsWRITING ATRIGONOMETRICMODELG raphs of sine and cosine functions are called sinusoids. When you write a sine orcosine function for a sinusoid, you need to find the values of a, b>0, h, and kfory= a sin b(x h) + kor y = a cos b(x h) + kwhere |a| is the amplitude, 2b is the period, h is the horizontal shift, and kis thevertical Trigonometric FunctionsWrite a function for the the maximum and minimum values of the function occur at pointsequidistant from the x-axis, the curve has no vertical shift. And because theminimum occurs on the y-axis, the graph is a reflection of a cosine curve with no horizontal shift. Therefore, the function has the form y= period is 2b = 23 , so b= amplitude is |a| = 4. Since the graph is a reflection, a= 4. The function is y= 4 cos the maximum and minimum values of the function do notoccur at pointsequidistant from the x-axis, the curve has a vertical shift.
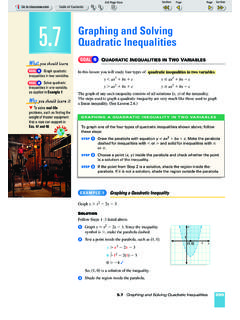
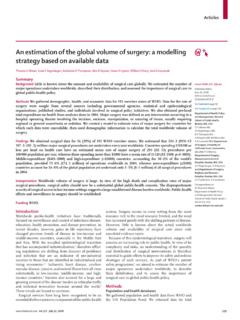
2 To find the value of k,add the maximum and minimum values and divide by 2:k= M+2m = = 210 = 5 Because the graph crosses the y-axis at y=k, the graph is a sine curve with nohorizontal shift. Therefore, the function has the form y=asin bx period is 2b = 2, so b= .The amplitude is |a|= M 2m == 220 = the graph is not a reflection, a= 10 > 0. The function is y= 10 sin x ( 15) 25 + ( 15) ( , 15)( , 5) 3yx2 , 4 3(0, 4)EXAMPLE 1 GOAL1 Model data with asine or cosine technology towrite a trigonometric model,as applied in Example 4. To model many types of real-lifequantities, such as the temperatureinside and outside an igloo in Ex. you should learn itGOAL2 GOAL1 What you should DATAANDSTATISTICSREALLIFEREALLIFEHOMEWOR K HELPV isit our Web extra 1 of with Trigonometric Functions863 Modeling a SinusoidWrite a trigonometric model for the average daily temperature in Birmingham,Alabama.
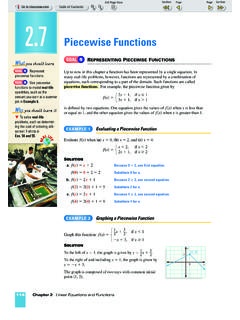
3 Source: National Climatic data CenterSOLUTIONN otice that the graph crosses the T-axis at the minimum point. So if you model thetemperature curve with a cosine function, there is a reflection but no horizontal mean of the maximum and minimum values is 60, so there is a vertical shift of k= 60. The period is 2b = 12, so b= 6 . The amplitude is |a| = 20, and because the graph is a reflection it follows that a = 20. The model is T= 20 cos 6 t+ 60 where t is measured in months and t= 0represents January Circular MotionA Ferris wheel with a radius of 25 feet is rotating at a rate of 3 revolutions perminute. When t= 0, a chair starts at the lowest point on the wheel, which is 5 feetabove the ground. Write a model for the height h (in feet) of the chair as a function of the time t(in seconds).SOLUTIONWhen the chair is at the bottom of the Ferris wheel, it is 5 feet above the ground, som= 5.
4 When it is at the top, it is 5 + 2(25) = 55 feet above the ground, so M= vertical shift for the model is k= M+2m = 552+5 = 620 = t= 0, the height is at its minimum, so the model is a cosine function witha< 0 and no horizontal amplitude is |a|= M 2m = 552 5 = 520 = 25. Because a< 0 it follows thata= the Ferris wheel is rotating at 3 revolutions per minute, it completes one revolution in 20 seconds. The period is 2b = 20, so b= 1 0 . A model for the height of the chair as a function of time is h= 25 cos 1 0 t+ 3 EXAMPLE 2 Months since January 124 Temperature ( F)406080tT60081020 Daily Temperature in BirminghamREALLIFEREALLIFEM eteorologyREALLIFEREALLIFEF erris WheelPage 1 of 2864 Chapter 14 Trigonometric Graphs, Identities, and EquationsSINUSOIDALMODELINGUSINGTECHNOLO GYT here are two ways you can model a set of data points whose scatter plot appearssinusoidal. One way is to estimate the minimum and maximum values and use thetechnique shown in Example 2.
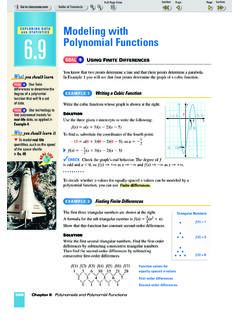
5 Another way is to use a graphing calculator that has a sinusoidal regression feature. The advantage of the second method is that it uses all of the data points to find the Sinusoidal RegressionThe average daily temperature T(in degrees Fahrenheit) in Fairbanks, Alaska, isgiven in the table. Time t is measured in months, with t= 0 representing January a trigonometric model that gives Tas a function of t. Source: National Climatic data CenterSOLUTIONB egin by entering the data in a graphing calculator and drawing a scatter plot. Enter the a scatter the scatter plot appears sinusoidal, you can fit the data with a sine functionto get the following model:T = sin ( ) + a sinusoidal Graph the model and the data in same viewing obtaining the model, you should graph it in the same viewing window as thescatter plot to see how well the model fits the data . In this case, the model is a good fit.
6 CHECK As a check on the reasonableness of the model, notice that the period is 18 12, which is the number of months in a y=a*sin(bx+c)+d a= b=.5184527958 c= d= L2 (1)=.5 EXAMPLE 1 of with Trigonometric this statement: Graphs of sine and cosine functions are called ?. two points are most useful when writing a sinusoidal model for a givengraph or set of data ? a characteristic of a sinusoidal graph that you would model with acosine function rather than a sine a function for the a function for the sinusoid with maximum at Aand minimum at (0, 8), B( , 2) ( , 10), B(3 , 4) (6, 5), B(2, 1) back at Example 3. Suppose the Ferris wheel rotatesat a rate of 4 revolutions per minute and has a radius of 20 feet. Write a modelfor the height h(in feet) of the chair as a function of the time t(in seconds).
7 WRITINGFUNCTIONSW rite a function for the (2, 6)(0, 2)x2334 , 0 14 , 2 yxy41(0, 4)(1, 4) 3xy3 , 2 2 , 2 6x 45 , 5 3 4 , 5 4xy 23 , 3 4(0, 3)PRACTICEANDAPPLICATIONSxy 41(1, 3)(0, 1)xy 32 , 1 2 , 1 6 GUIDEDPRACTICEV ocabulary Check Concept Check Skill Check STUDENTHELPE xtra Practice to help you masterskills is on p. HELPE xample 1:Exs. 10 27 Example 2:Exs. 30, 32 Example 3:Exs. 31, 33 Example 4:Exs. 34, 35 Page 1 of 2866 Chapter 14 Trigonometric Graphs, Identities, and EquationsWRITINGTRIGONOMETRICFUNCTIONSW rite a function for the sinusoid withmaximum at Aand minimum at (0, 3), B(2 , 3) ( , 8), B(3 , 8) (9 , 1), B(3 , 5) 3 , 4 , B(0, 2) (2, 6), B(6, 0) (3, 7), B(1, 3) 23 , 9 , B(2 , 5) 6 , 11 , B(0, 1) (0, 5), B(4, 13) (0, 0), B(3 , 8) (6, 2), B(0, 4) 4 , 2 , B 1 2 , 6 sinusoid can be modeled by either a sine function ora cosine function.
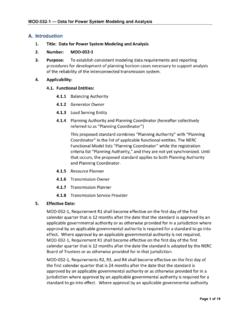
8 Using the graph from part (a) of Example 1, find the values ofa, b, h, and kfor the model y= asin b(x h) + k. Use identities to show thatthe model you found is equivalent to the model from part (a) of Example Since any sinusoid can be modeled by either a sine function or acosine function, you can choose the type of function that is more convenient. For a sinusoid whose y-intercept occurs halfway between the maximum andminimum values of the function, tell which type of function you would use tomodel the graph. Explain your use igloos as temporaryshelter from harsh winter graph shows the temperaturesinside and outside an igloothroughout a typical winter a sinusoidal model for theoutside temperature T(in degreesFahrenheit) as a function of thetime of day t(in hours sincemidnight). Then write sinusoidalmodels for the floor-leveltemperature and for the sleeping-platform temperature.
9 Source: Scientific paddle wheel of the Beaver was 13 feet in diameterand revolved 30 times per minute when moving at top speed. Using this speedand starting from a point at the very top of the wheel, write a model for theheight h(in feet) of the end of a paddle relative to the water s surface as afunction of the time t(in minutes).(Assume the paddle is 2 feet below thewater s surface at its lowest point.) Source: Beaver: The Ship That Saved the height of the water in a bay varies sinusoidally overtime. On a certain day off the coast of Maine, a high tide of 10 feet occurred at5 and a low tide of 2 feet occurred at 1 Write a model for theheight h(in feet) of the water as a function of time t(in hours since midnight). front of the Antique Sewing Machine Museum inArlington, Texas, is the largest sewing machine in the world. The flywheel, whichturns as the machine sews, is 5 feet in diameter.
10 Write a model for the height h(in feet) of the handle on the flywheel as a function of the time t(in seconds),assuming that the wheel makes a complete revolution every 2 seconds and thatthe handle starts at its minimum height of 4 feet above the BEAVERwas the first steam-ship on the Pacific Coast. Itwas built in the 1830s andsailed out of BritishColumbia, Canada, for over50 ONAPPLICATIONSH ours since 8 TemperaturesTemperature ( F)42040T0t 208 121620 Page 1 of with Trigonometric Functions867In Exercises 34 and 35, use a graphing calculator tofind a sinusoidal model that fits the average daily temperature T(in degrees Fahrenheit) inMoline, Illinois, is given in the table. Time t is measured in months, with t=0representing January 1. Find a model for the data . Source: National Climatic data SFor any given day, the number of degrees thatthe average temperature is below 65 F is called the degree-daysfor that day.