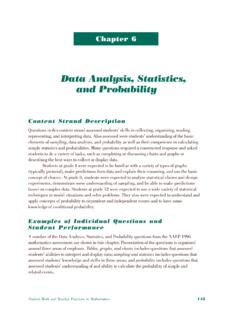
Transcription of Factors That Influence Student College Choice
1 DEPARTMENT OF EDUCATIONNCES 2019-119 NOVEMBER 2018 Factors That Influence Student College Choice This report is based on data from the High School Longitudinal Study of 2009 (HSLS:09), a nationally representative, longitudinal study of more than 23,000 ninth-graders in 2009. The cohort was surveyed again in spring 2012 when most students were in eleventh grade. This survey in-cluded questions about characteristics that would Influence choosing a school or College after high school. What Factors do students rate as important when they are choosing a school or College to attend after high school? FIGURE 1. Percentage distribution of students ratings of the importance of Factors that Influence College Choice among fall 2009 ninth-graders in spring 2012 NOTE: Percentages may not sum to 100 due to rounding. SOURCE: Department of Education, Institute of Education Sciences, National Center for Education Statistics.
2 High School Longitudinal Study of 2009 (HSLS:09) First Follow-up Public-Use Data File (NCES 2014-358). The three Factors with the highest percentages of "very important" ratings were academic quality/ reputation (74 percent), having a desired program of study (74 per-cent), and job placement (73 per-cent) (Figure 1). Two-thirds (67 percent) of students rated cost of attendance as a "very important" Influence on their College Choice (Figure 1). Being far from home (12 percent) and family legacy status (9 percent) had the lowest percentages of "very important" ratings (Figure 1). Data in this report are from the High School Longitudinal Study of 2009 (HSLS:09), a nationally representative sample survey. To learn more, visit For questions about content or to view this report online, go to Factors That Influence Student College Choice How do self-reported ratings of the importance of cost of attendance vary bysocioeconomic status (SES)?
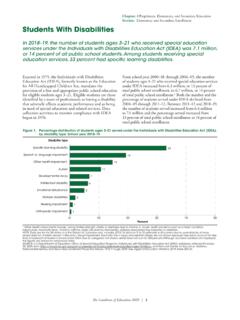
3 Recent research has shown that many high school students overestimate or un-derestimate the costs of public colleges in their state, which may affect their College Regardless of SES, over 95 percent of respondents rated the cost of attendance to be a somewhat important or very important factor in their Choice of College (Figure 2). Similar percentages of students in the lowest SES quintile (73 percent) and middle three SES quintiles (70 per-cent) reported that cost of attendance was a "very important" Influence on their College Choice . By comparison, 56 percent of students in the highest SES quintile rated cost as a "very important" factor (Figure 2). FIGURE 2. Percentage distribution of students ratings of the importance of cost of attendance in their College Choice among fall 2009 ninth-graders in spring 2012, by socioeconomic status (SES) NOTE: Percentages may not sum to 100 due to rounding.
4 Socioeconomic status (SES) is a composite score of the family's relative social position based on parents' education, occupational prestige, and family income. The lowest SES quintile is the lowest one-fifth ( , lowest 20 percent) of the SES distribution, and the highest SES quintile is the highest one-fifth ( , highest 20 percent). SOURCE: Department of Education, Institute of Education Sciences, National Center for Education Statistics. High School Longitudinal Study of 2009 (HSLS:09) First Follow-up Public-Use Data File (NCES 2014-358). References 1 Department of Education, Institute of Education Sciences, National Center for Education Statistics. NCES 2019-404. Stats in brief: What high schoolers and their parents know about public 4-year tuition. Retrieved from This NCES Data Point presents information about education topics of current interest.
5 It was authored by Allison LaFave, Emily Kelly, and Jacob Ford of AnLar. Estimates based on samples are subject to sampling variability, and apparent differences ma y not be statistically significant. All stated differ-ences are statistically significant at the .05 level using a two-tailed Student 's t-test. In the de sign, conduct, and data processing of NCES surveys, efforts are ma de to minimize effects of non-sampling errors, such as item response, measurement error, data processing error, or other systematic error.