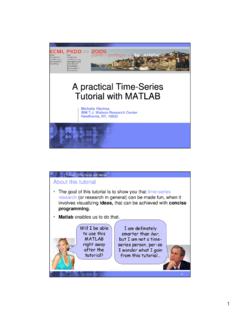
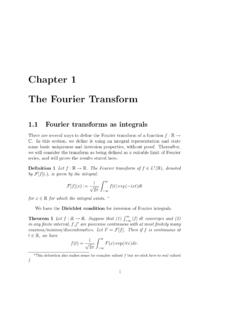
Transcription of Fast Fourier Transform MATLAB Implementation
1 Fast Fourier Transform and MATLAB ImplementationbyWanjun HuangforforDr. Duncan L. MacFarlane1 SignalsIn the fields of communications, signal processing, and in electrical engineeringmore generally, a signal is any time varying or spatial varying quantityThis variable(quantity) changes in time Speech or audio signal: A sound amplitude that varies in time Temperature readings at different hours of a day Stock price changes over days Etc can be classified by continues time signal and discrete time signal: A discrete signal or discrete time signal is a time series, perhaps a signal that hbldftitiilhas been sampled from a continuous time signal A digital signal is a discrete time signal that takes on only a discrete set of values1 Continuous Time Signal1 Discrete Time (t) [n]010203040-1 Time (s ec )010203040-1n2 Periodic Signalperiodic signal and non periodic signal:1 Periodic Signal1 Non-Periodic Signal010203040-10f(t)Ti m e (s ec )010203040-10f[n]nn Period T.
2 The minimum interval on which a signal repeats Fundamentalfrequency:f0=1/TFundamental frequency: f01/T Harmonic frequencies: kf0 Any periodic signal can be approximated by a sum of many sinusoids at harmonic frequencies of the signal(kf0) with yyqg(f0)appropriate amplitude and phase Instead of using sinusoid signals, mathematically, we can use the complex exponential functions with both positive and negative harmonic frequencies)cos()sin()exp(tjttj Euler formula:3 Time Frequency Analysis A signal has one or more frequencies in it, and can be viewed from two different standpoints: Time domain and Frequency domainTime Domian (Banded Wren Song)01 Amplitude Time Domia n (Banded Wren Song)12 Power Frequency Domain02468x 104-1 Sample NumberA0200400600800100012000 Frequency (Hz)Time domain figure: how a signal changes over timeWhyfrequencydomainanalysis?gggFreque ncy domain figure: how much of the signal lies within each givenfrequency band over a range of frequenciesWhy frequency domain analysis?
3 To decompose a complex signal into simpler parts to facilitate analysis Differential and difference equations and convolution operations in the time domain become algebraic operations in the frequency domain Fast Algorithm (FFT)4 FourierTransformFourier TransformWe can go between the time domain and the frequency domainbyusinga tool calledFourier Transform A Fourier Transform converts a signal in the time domain to the frequency domain(spectrum) AiFifhfdiygf An inverse Fourier Transform converts the frequency domain components back into the original time domain signalContinuous TimeFourierTransform: dejFtftj )(21)( dtetfjFtj )()(ContinuousTime Fourier Transform :Discrete TimeFourierTransform(DTFT):DiscreteTime Fourier Transform (DTFT): 2)(21][deeXnxnjj nnjjenxeX ][)(5 FourierRepresentationForFourTypesofSigna lsFourier Representation For Four Types of SignalsThe signal with different time domain characteristics has different frequency domain characteristics1 Continues time periodic signal > discrete non periodic spectrumqyp2 Continues time non periodic signal > continues non periodic spectrum3 Discretenon periodicsignal >continuesperiodicspectrum3 Discrete nonperiodic signal > continues periodic spectrum4 Discrete periodic signal > discrete periodic spectrumThe last transformation between time domain and frequency is most qyusefulThe reason that discrete is associated with both time domain and frequency domain is because computers can only take finite discrete time signalspyg6 PeriodicSequencePeriodic Sequence)(~)(~kNnxnx ,wherekis integerA periodic sequence with periodNis defined as.
4 Periodic,gknNjknNeW 2 For example:)()(NnknNkknWWW (it is calledTwiddle Factor)Properties:Periodic)()(NnkNnNkNkn NWWW Symmetric)()(*)(nNkNnkNNknNknNWWWW Properties:Orthogonal otherrNnNWNkknN010 For a periodic sequence with period N, only Nsamples are independent. So that Nsample in one period is enough to representthewholesequence x(n)represent the whole sequence7 DiscreteFourierSeries(DFS)Discrete Fourier Series(DFS)Periodic signals may be expanded into a series of sine and cosinefunctions 1010)(~1)(~)(~)(~NknNNnknNWkXNnxWnxkXcos ine functions))(~()(~))(~()(~kXIDFS nxnxDFSkX 0nNis still a periodic sequence with periodNin frequencydomain)(~kXThe Fourier series for the discrete time periodic wave shown below:1 Sequence x (in time domain) Length Sequence )(nxNn10 Real lift signal is generally afi ilhIfweperiodicextenditbytheperiodNthen rNnxnx)()(~ 0)()(nxnxothersNn10 finitelengthsequenceIf we periodic extend it by the period N, then rrNnxnx)()()(nx)(~nx 9 Relationship Between Finite Length Sequence dPidiSand Periodic SequenceA periodic sequence is the periodic extension of a finite lengthAfinitelengthsequenceistheprincipa lvalueintervaloftheperiodicsequence mNnxrNnxnx))(()()(~A finite length sequence is the principal value interval of the periodic sequence )()(~)(nRnxnxN 01)(nRNothersNn10 Where 0othersSo that.
5 ()](~[)()(~)(nRkXIDFSnRnxnxNN )()](~[)()(~)()()]([)()()(nRnxDFSkRkXkXN NNN 10 DiscreteFourierTransform(DFT)Discrete Fourier Transform (DFT) Using the Fourier series representation we have Discrete FourierTransform(DFT)forfinitelengthsign alFourier Transform (DFT) for finite length signal DFT can convert time domain discrete signal into frequency domain discrete spectrumAssume that we have a signal . Then the DFT of the signal is a sequence for 10]}[{ Nnnx][kX1,,0 Nk 10/2][][NnNjnkenxkX The Inverse Discrete Fourier Transform (IDFT): 10 ,,2,0,][1][NkNjnkNnekXNnx NotethatbecauseMATLAB cannotuseazeroornegativeNote that because MATLAB cannot use a zero or negative indices, the index starts from 1 in MATLAB 11 DFTE xampleDFT ExampleThe DFT is widely used in the fields of spectral analysis, acousticsmedicalimagingandtelecommunicat ionsacoustics, medical imaging, and domain signalFor example:0123 Amplitude)3,2,1,0(,4],6142[][ nNnxnknkjjnxenxkX)(][][][30230 116)1(42]0[ XjjjX2361)4(2]1[ 1012 Frequency domain signal96)1()4(2]2[ XjjjX2361)4(2]3[ 46810|X[k]| (FFT)Fast Fourier Transform (FFT) The Fast Fourier Transform does not refer to a new or differenttype of Fourier Transform .)
6 It refers to a veryefficient algorithm forypygcomputing the DFT The time taken to evaluate a DFT on a computer FFT only needsNlog2(N) The central insight which leads to this algorithm is therealizationthatadiscreteFouriertransf ormofasequenceofNrealizationthatadiscret eFouriertransformofasequenceofNpoints can be written in terms of two discrete Fourier transformsof lengthN/2 ThusifNisapoweroftwoitispossibletorecurs ivelyapplyThusifNisapoweroftwo,itispossi bletorecursivelyapplythis decomposition until we are left with discrete Fouriertransforms of single points13 FastFourierTransform(cont.)Fast Fourier Transform (cont.)Re writing 10/2][][NnNjnkenxkX as 10][][NnnkNWnxkXItiseasytorealizethatthe samevaluesofarecalculatedmanytimesasthen kWIt is easy to realize that the same values of are calculated many times as the computation proceedsUsing the symmetric property of the twiddle factor, we can save lots of computationsNW111 NNN)12()2()()(][][12)12(122101010 WrxWrxWnxWnxWnxkXNrkNNkrNNnoddnknNNneven nknNNnnkN )()()()()12()2(120221202100kXWkXWrxWWrxW rxWrxkNrkrNkNNrkrNrNrN )()(21kXWkXkN Thus the N point DFT can be obtained from two N/2 point transforms, one on even input data, and one on odd input for MATLABMATLABis a numerical computing environment developed byMathWorks.
7 MATLAB allows matrix manipulations,plottingofp,pgfunctions and data, and Implementation of algorithmsGettinghelpGettinghelpYou can get help by typing the commandshelporlookforatthe >> prompt, >>helpfft>>helpfftArithmetic operatorsSymbol Operation Example+Addition31+9+ +9 Subtraction 5* Multiplication 2 * 3/Division5/2/Division5/2^Power3^215 DataRepresentationsinMATLABData Representations in MATLABV ariables:Variablesaredefinedastheassignm entoperator = .Thesyntaxofvariable assignment isibll(i)variable name = a value(or an expression)For example,>> x = 5x=5>> y = [3*7, pi/3]; % pi is in MATLABV ectors/MatricesMATLAB cancreateandmanip latearra sof1(ectors)2 Vectors/Matrices: MATLAB cancreateandmanipulatearraysof1(vectors) ,2(matrices), or more dimensionsrow vectors: a = [1, 2, 3, 4] is a 1X4 matrixcolumn vectors: b = [5; 6; 7; 8; 9] is a 5X1 matrix, >>A=[123;789;456]A = 12378945645616 MathematicalFunctionsinMATLABM athematical Functions in MATLABMATLAB offers many predefined mathematical functions fortechnical computing, ,gcos(x) Cosine abs(x) Absolute valuesin(x) Sine angle(x) Phase angleexp(x)Exponentialconj(x)Complex conjugateColonoperator(:)exp(x)Exponenti alconj(x)Complex conjugatesqrt(x) Square root log(x) Natural logarithmColonoperator(:)Suppose we want to enter a vectorxconsisting of points(0.)
8 ,5). We can use the command>> x = 0 :5;;Most of the work you will do in MATLAB will be stored in files calledscripts,orm files, containing sequences of MATLAB commands to beexecuted over and over again17 BasicplottinginMATLABB asic plotting in MATLABMATLAB has an excellent set of graphic tools. Plotting a given data set orthe results of computation is possible with very few commandsThe MATLAB command to plot a graph is plot(x,y), >> x = 0:pi/100:2*pi; functionp/ p;>> y = sin(x);>> plot(x,y) enables you to add axisLabels and titles, \ of x>> xlabel('x=0:2\pi');>> ylabel('Sine of x');>> tile('Sine function') :2 x0:2 18 Example1:SineWaveExample 1: Sine Wave SignalFs = 150; % Sampling frequencyt = 0:1/Fs:1; % Time vector of 1 second f = 5; % Create a sine wave of f (2* i*t*f) = sin(2*pi*t*f); nfft = 1024; % Length of FFT% Take fft, padding with zeros so that length(X) is equal to nfft X = fft(x,nfft); % FFT is symmetric, throw away second m e (s )80 Power Spectrum of a Sine Wave% FFT is symmetric, throw away second half X = X(1:nfft/2); % Take the magnitude of fft of xmx = abs(X);% Frequency vectorf = (0:nfft/2-1)*Fs/nfft.
9 406080 Power% Generate the plot, title and labels. figure(1);plot(t,x);title('Sine Wave Signal'); xlabel('Time (s)'); lbl('A lit d ')01020304050607080020 Frequency (Hz)Pylabel('Amplitude'); figure(2);plot(f,mx); title('Power Spectrum of a Sine Wave'); xlabel('Frequency (Hz)'); ylabel('Power');Frequency (Hz)ylabel(Power); 19 Example2:CosineWaveExample 2: Cosine WaveFs = 150; % Sampling frequencyt = 0:1/Fs:1; % Time vector of 1 second f = 5; % Create a sine wave of f (2*pi*t*f); Wave Signalx = cos(2*pi*t*f); nfft = 1024; % Length of FFT% Take fft, padding with zeros so that length(X) is equal to nfft X = fft(x,nfft); % FFT is symmetric, throw away second half , yX = X(1:nfft/2); % Take the magnitude of fft of xmx = abs(X);% Frequency vectorf = (0:nfft/2-1)*Fs/nfft; e (s )80 Power Spectrum of a Cosine Wave% Generate the plot, title and labels. figure(1);plot(t,x);title('Sine Wave Signal'); xlabel('Time (s)'); ylabel('Amplitude');406080 Powerylabel(Amplitude); figure(2);plot(f,mx); title('Power Spectrum of a Sine Wave'); xlabel('Frequency (Hz)'); ylabel('Power'); 01020304050607080020 Frequency (Hz)PyFrequency (Hz)20 Example3:CosineWavewithPhaseShiftExample 3: Cosine Wave with Phase ShiftFs = 150; % Sampling frequencyt = 0:1/Fs:1; % Time vector of 1 second f = 5; % Create a sine wave of f = 1/3*pi; %phase Wave Signal with Phase Shiftpha = 1/3*pi; % phase shift x = cos(2*pi*t*f + pha); nfft = 1024; % Length of FFT% Take fft, padding with zeros so that length(X) is equal to nfft X = fft(x,nfft); (,)% FFT is symmetric, throw away second half X = X(1:nfft/2); % Take the magnitude of fft of xmx = abs(X);% Frequency m e (s )80 Power Spectrum of a Cosine Wave Signal with Phase Shiftf = (0:nfft/2-1)*Fs/nfft.
10 % Generate the plot, title and labels. figure(1);plot(t,x);title('Sine Wave Signal'); xlabel('Time (s)');406080 Powerxlabel(Time (s)); ylabel('Amplitude'); figure(2);plot(f,mx); title('Power Spectrum of a Sine Wave'); xlabel('Frequency (Hz)'); 01020304050607080020 Frequency (Hz)Pqyylabel('Power'); Frequency (Hz)21 Example4:SquareWaveExample 4: Square Wave SignalFs = 150; % Sampling frequencyt = 0:1/Fs:1; % Time vector of 1 second f = 5; % Create a sine wave of f = square(2*pi*t*f); = square(2*pi*t*f); nfft = 1024; % Length of FFT% Take fft, padding with zeros so that length(X) is equal to nfft X = fft(x,nfft); % FFT is symmetric, throw away second half m e (s )100 Power Spectrum of a Square Wavey, yX = X(1:nfft/2); % Take the magnitude of fft of xmx = abs(X);% Frequency vectorf = (0:nfft/2-1)*Fs/nfft; 406080100 Power% Generate the plot, title and labels. figure(1);plot(t,x);title('Square Wave Signal'); xlabel('Time (s)'); ylabel('Amplitude');02040608002040 Frequency (Hz)ylabel(Amplitude); figure(2);plot(f,mx); title('Power Spectrum of a Square Wave'); xlabel('Frequency (Hz)'); ylabel('Power'); y22 Example5:SquarePulseExample 5: Square Pulse SignalFs = 150; % Sampling frequencyt = :1/ ; % Time vector of 1 second w =.