Transcription of Functions and Their Graphs - ClassZone
1 Page 1 of and Their Graphs67 Functions and Their GraphsREPRESENTINGRELATIONS ANDFUNCTIONSA is a mapping, or pairing, of input values with output values. The set ofinput values is the and the set of output values is the A relation is aprovided there is exactly one output for each input. It is not a function if atleast one input has more than one (and Functions ) between two quantities can be represented in many ways,including mapping diagrams, tables, Graphs , equations, and verbal FunctionsIdentify the domain and range. Then tell whether the relation is a domain consists of 3, 1, and 4, and the range consists of 2, 1, 3, and relation is not a function because the input 1 is mapped onto both 2 and domain consists of 3, 1, 3, and 4, and the range consists of 2, 1, and relation is a function because each input in the domain is mapped ontoexactly one output in the .. A relation can be represented by a set of of the form (x, y).
2 In anordered pair the first number is the x-coordinateand the second number is the y-coordinate. To graph a relation, plot each of its ordered pairs in a such as the one shown. A coordinate plane is divided into four quadrantsby the x-axisand the y-axis. The axes intersect at a point called the (0, 0) 4 3 2 2 3 4 5 8 6 78642475313yx21 9 10109Oy-axisQuadrant Ix 0, y 0 Quadrant IVx 0, y 0 Quadrant IIIx 0, y 0 Quadrant IIx 0, y 0plane,coordinateordered pairs31 2 InputOutput 3134 InputOutput3 214 314 EXAMPLE ,relationGOAL1 Representrelations and andevaluate linear Functions , asapplied in Exs. 55 and 56. To model real-lifequantities, such as the distance a hot air balloon travels in Example you should learn itGOAL2 GOAL1 What you should TipAlthough the origin Oisnot usually labeled, it isunderstood to be thepoint (0, 0).Page 1 of 268 Chapter 2 Linear Equations and FunctionsGraphing RelationsGraph the relations given in Example the relation as a set of the relation as a set of ordered pairs: ( 3, 3), (1, 2), ordered pairs: ( 3, 3), (1, 1), (1, 1), (4, 4).
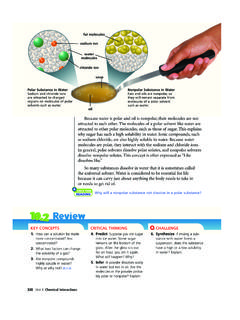
3 Then plot the(3, 1), (4, 2). Then plot thepoints in a coordinate in a coordinate .. In Example 2 notice that the graph of the relation that is not a function (the graph onthe left) has two points that lie on the same vertical line. You can use this property asa graphical test for other than xand yare often used when working with relations in real-lifesituations, as shown in the next the Vertical Line Test in Real LifeFORESTRYThe graph shows the ages aanddiameters dof several pine trees at LundbreckFalls in Canada. Are the diameters of the trees a function of Their ages? Explain. Source: National Geographical Data CenterSOLUTIONThe diameters of the trees are not a function oftheir ages because there is at least one verticalline that intersects the graph at more than onepoint. For example, a vertical line intersects thegraph at the points (75, ) and (75, ). So, at least two trees have the same age butdifferent 3yyx11( 3, 3)(4, 2)(1, 1)(3, 1)yyx11( 3, 3)(1, 2)(1, 1)(4, 4)EXAMPLE 2A relation is a function if and only if no vertical line intersects the graph of therelation at more than one LINE TEST FOR FUNCTIONSD iameter (meters)Age (years) TreesdaFORESTERA forester manages,develops, and protectsnatural resources.
4 Tomeasure the diameter of trees, a forester uses a special tool calleddiameter tape. CAREER ONCAREERSS kills Review For help with plottingpoints in a coordinateplane, see p. 1 of 2 GRAPHING ANDEVALUATINGFUNCTIONSMany Functions can be represented by an in two variables, such as y= 2x 7. An ordered pair (x,y) is a of such an equation if the equationis true when the values of xand yare substituted into the equation. For instance, (2, 3) is a solution of y= 2x 7 because 3 = 2(2) 7 is a true an equation, the input variable is called the The outputvariable is called the and depends on the value of the inputvariable. For the equation y= 2x 7, the independent variable is xand thedependent variable is of an equation in two variables is the collection of all points (x, y) whosecoordinates are solutions of the a FunctionGraph the function y= x+ by constructing a table of the points. Notice the five points lie on a a line through the.
5 The function in Example 4 is a because it is of the formy = mx + bLinear functionwhere mand bare constants. The graph of a linear function is a line. By naming afunction you can write the function using (x) = mx+ bFunction notationThe symbol (x) is read as the value of at x, or simply as of x. Note that (x)is another name for y. The domain of a function consists of the values of xfor whichthe function is defined. The range consists of the values of (x) where xis in thedomain of . Functions do not have to be represented by the letter . Other letterssuch as gor hcan also be function321 EXAMPLE 4graphdependent variableindependent and Their Graphs69To graph an equation in two variables, follow these steps:STEP Construct a table of graph enough solutions to recognize a Connect the points with a line or a EQUATIONS IN TWO VARIABLES1x2yChoose x. 2 1 012 Evaluate y. 10123 STUDENTHELPS tudy TipWhen you see functionnotation (x), rememberthat it means the valueof at x.
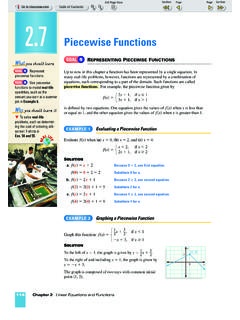
6 It does notmean times x. Page 1 of 270 Chapter 2 Linear Equations and FunctionsEvaluating FunctionsDecide whether the function is linear. Then evaluate the function when x= (x) = x2 3x+ (x) = 2x+ 6 SOLUTIONa. (x) is not a linear function because it has an x2-term. (x)= x2 3x+ 5 Write function. ( 2)= ( 2)2 3( 2) + 5 Substitute 2 for (x) is a linear function because it has the form g(x) = mx+ (x)= 2x+ 6 Write ( 2)= 2( 2) + 6 Substitute 2 for .. In Example 5 the domain of each function is all real numbers. In real-life problemsthe domain is restricted to the numbers that make sense in the real-life a Function in Real LifeBALLOONINGIn March of 1999, Bertrand Piccard and Brian Jones attempted tobecome the first people to fly around the world in a balloon. Based on an averagespeed of kilometers per hour, the distance d(in kilometers) that they traveledcan be modeled by d= tis the time (in hours). They traveled a total ofabout 478 hours.
7 The rules governing the record state that the minimum distancecovered must be at least 26,700 kilometers. Source: the domain and range and determine whether Piccard and Jones set the the function. Then use the graph to approximate how long it took them totravel 20,000 Their trip lasted 478 hours, the domain is 0 t 478. The distance they traveled was d= (478) 46,700 kilometers, so the range is 0 d 46,700. Since 46,700 > 26,700, they did set the graph of the function is shown. Note that the graph ends at (478, 46,700). To find how long it took them to travel 20,000 kilometers, start at 20,000 on the d-axis and move right until you reach the graph . Then move down to the t-axis. It took them about 200 hours to travel 20,000 6 EXAMPLE 5 Time (hours)200400 Distance (km)0dt010,000(478, 46,700)60020,00030,00040,00050,000 Distance TraveledHOMEWORK HELPV isit our Web extra ANDJONESare the first pilots to fly around the world in a balloon.
8 Piccard is a medical doctor inSwitzerland specializing inpsychiatry, and Jones is amember of the Royal AirForce in the United ONPEOPLEPage 1 of are the domain and range of a relation? why a vertical line, rather than a horizontal line, is used to determine if a graph represents a the process for graphing an the domain and range of the relation shown. Then tell whether the relation is a the x 2x+ x+ 9 Evaluate the function when x= (x) = x12. (x) = 6x13. (x) = (x) = 2x+ (x) = x2+ (x) = x3 7xHIGHWAYDRIVINGIn Exercises 17 and 18, use the following information. A car has a 16 gallon gas tank. On a long highway trip, gas is used at a rate of about2 gallons per hour. The gallons of gas gin the car s tank can be modeled by theequation g= 16 2twhere tis the time (in hours). the domain and range of the function. Then graph the the end of the trip there are 2 gallons of gas left. How long was the trip?
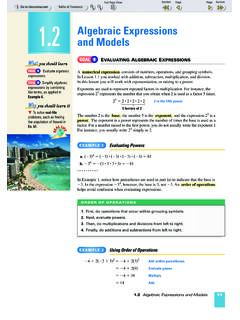
9 DOMAIN ANDRANGEI dentify the domain and the relation. Then tell whether the relation is a 2 134 351 InputOutput25 163 and Their Graphs71 Vocabulary Check Concept Check Skill Check x1y1Ex. 4 Extra Practiceto help you masterskills is on p. HELPE xample 1:Exs. 19 27 Example 2:Exs. 22 27 Example 3:Exs. 30 32,51 54 Example 4:Exs. 34 42 Example 5:Exs. 43 50 Example 6:Exs. 55 58x002244y 4 4 3 3 1 1x 2 2 0 5 4 30345y 6 4 2 1 2 4 6 Page 1 of 272 Chapter 2 Linear Equations and FunctionsMAPPINGDIAGRAMSUse a mapping diagram to represent the relation. Thentell whether the relation is a Is a function always a relation? Is a relation always a function?Explain your the vertical line test as two if-then the vertical line test to determine whether therelation is a does y= 3 represent a function, but x= 3 does not?GRAPHINGFUNCTIONSG raph the x x+ 2x+ 5x+ 3x 2x 23 x+ 4 EVALUATINGFUNCTIONSD ecide whether the function is linear.
10 Thenevaluate the function for the given value of (x) = x 11; (4)44. (x) = 2; ( 4)45. (x) = |x| 5; ( 6)46. (x) = 9x3 x2+ 2; (2)47. (x) = 23 x2 x+ 5; (6)48. (x) = 3 + 4x; 12 volume of a cube with side length sis given bythe function V(s) = s3. Find V(5). Explain what V(5) volume of a sphere with radius ris given by the function V(r) = 43 r3. Find V(2). Explain what V(2) graphshows the ages and finishing places ofthe top three competitors in each of thefour categories of the 100th BostonMarathon. Is the finishing place of acompetitor a function of his or her age?Explain your reasoning. Source: Boston Athletic AssociationGEOMETRYCONNECTIONGEOMETRYCON NECTIONx11yx13yx11yx12yx2y1x11yPlaceAge2 230263438100th Boston Marathon3021apSkills Review For help with if-thenstatements, see p. 1 of OFREPRESENTATIVESThe graph shows the number ofIndependent representatives for the100th 105th Congresses. Is thenumber of Independent representativesa function of the Congress number?