Transcription of Gas Chromatography: Principles and Determination of ...
1 Truman State University CHEM 222 Lab Manual Revised 03/30/11 Gas chromatography : Principles and Determination of Percent Alcohol INTRODUCTION In this experiment you will apply gas chromatography to the separation of a water-ethanol mixture. This method is often used in the Determination of alcohol ( ethanol) in blood or urine. One obvious application is when law enforcement agencies need to determine whether or not someone is inebriated. In these cases, high sensitivity is required since blood alcohol content is considered to be legally intoxicated in most states. Our own Determination will deal with higher concentrations (up to 25% by volume) which are more typical of alcohol levels found in many alcoholic beverages.
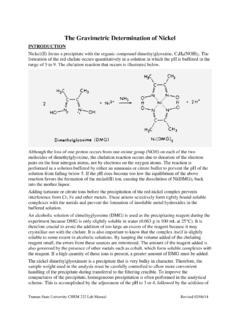
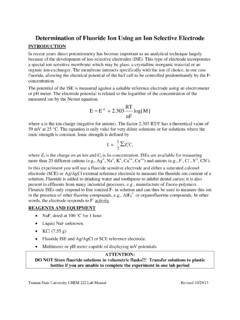
2 To help minimize the errors due to run-to-run variability, we will use n-propanol as an internal standard. Gas chromatography (GC) is a powerful and widely used tool for the separation, identification and quantitation of components in a mixture. In this technique, a sample is converted to the vapor state and a flowing stream of carrier gas (often helium or nitrogen) sweeps the sample into a thermally-controlled column (see diagram). In the case of gas-liquid chromatography , the column is usually packed with solid particles that are coated with a non-volatile liquid, referred to as the stationary phase. As the sample mixture moves through the column, sample components that interact strongly with the stationary phase spend more time in the stationary phase vs. the moving gas phase and thus require more time to move through the column.
3 For example, a non-polar molecule such as hexane would interact Truman State University CHEM 222 Lab Manual Revised 03/30/11 strongly with a non-polar stationary phase and would have a large retention time. Retention time is defined as the time from injection of the sample to the time a specific sample component is detected and is given the symbol tr. While polarity is usually the major factor governing separation, the boiling points of components of the sample also play a role in determining retention time. Components with higher volatility (lower boiling points) tend to spend more time in the moving gas phase and therefore tend to have shorter retention times. After exiting the column the (hopefully) separated components are detected and a detector response is recorded.
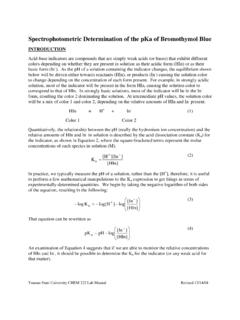
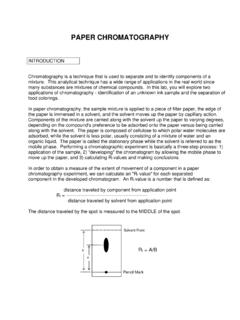
4 A typical gas chromatogram is shown below. The goal of GC is to separate and detect components of a mixture as efficiently as possible and it is thus desirable to have a measure of the efficiency of a given chromatographic column. One common way to express column efficiency is by calculating the height equivalent to a theoretical plate (HETP) which is the length of the column divided by the number of theoretical plates. HETP = l/n The number of theoretical plates (n) of a column with respect to a particular compound can be found using the following equation: N = 16(tr/w)2 = (tr/w1/2)2 where w is the peak width measured in the same units as tr and w1/2 is the peak width measured at half of the peak Truman State University CHEM 222 Lab Manual Revised 03/30/11 0 TimeSignalw1/2tr PROCEDURE Prepare five standard solutions in the range of roughly 4% to 25% (v/v) ethanol in water, with each standard containing a fixed (constant) percentage of n-propanol ranging from 5-10% (v/v).
5 Each flask must have the same concentration of n-propanol. Prepare these using your pipets and 25 mL volumetric flasks provided by your instructor. In addition, you need to transfer a 10 mL sample of your unknown into to a 25 mL volumetric flask, add sufficient n-propanol to attain the same %(v/v) concentration of that you created in your standard solutions and dilute to 25 mL. Your instructor will explain the operation of the gas chromatograph. Suggested Operating Conditions A. Hewlett-Packard Model 5890 GC Set "Detector A" On (Thermal Conductivity Detector) Packed Column Head Pressure: 30 psi Column: Carbowax 20M, 1/8" OD, length = 6 feet Oven Temperature: 110 C Detector Temperature: 150 C Injection Temperature: 150 C B. SRI Model 8610A GC Packed Column Head Pressure: 30 psi Column: Carbowax 20M, 1/8" OD, length = 6 feet Oven Temperature: 115 C Carrier Gas Flow Rate: 30 - 40 mL/min Truman State University CHEM 222 Lab Manual Revised 03/30/11 Note: The procedure for computer-based collection and analysis of the gas chromatographic data is described in a separate document.
6 You do not need to include this information in your procedural write-up. The remainder of the procedure that follows should be included in your procedural section. Reproducibility and Calculation of tR and HETP Inject L of an ethanol solution (one near 10% v/v) you have prepared (consult instructor for procedure) in the injection port of the GC. You should observe clean separation of the ethanol, propanol, and water and the peaks should be nearly symmetrical. Determine the identity of the peaks by injecting pure water, then pure n-propanol, and next injecting pure ethanol and comparing retention times. In order to determine the reproducibility for your injection method, inject three more samples of the 10% solution. In your report, tabulate tr for each peak in the six injections performed above.
7 Identify which peak corresponds to ethanol and which peak corresponds to water. For the four runs with the 10% solution, determine and tabulate peak areas and peak widths at half-height (w1/2). For these four runs, calculate the mean and the relative percent standard deviation of tr, w1/2, and peak area. Choose any one of the "10%" chromatograms and calculate HETP for ethanol and for n-propanol, showing your calculations. Begin by measuring w1/2 for each of the peaks in the chromatogram. Also calculate the resolution for the ethanol and propanol peaks. Determination of % Ethanol Inject each of the standard solutions and obtain a chromatogram. It is wise to make replicate injections of each standard solution. After the standards are complete, make replicate injections of your unknown.
8 Measure the peak areas and adjusted retention times for the ethanol and propanol peaks in each chromatogram. Data Handling and Calculations 1. Calculate the ratio of the area of the ethanol peak to the area of the n-propanol peak. 2. Prepare two plots: One of ratio of peak areas (calculated in #1) vs %(v/v) ethanol (an internal standards plot), and one of ethanol peak area vs %(v/v) ethanol. Perform a least squares regression analysis on both plots to determine slope and intercept and any associated uncertainties. 3. From the results of the regression analyses, determine mean and 95% confidence interval for the %(v/v) ethanol in your original unknown solution (prior to dilution) using each relationship. For your unknown report, use the result from the internal standards plot.
9 In your lab report, discuss any differences in the quality of the results from each approach and any benefits to using internal standards.