Transcription of General Motors Technical Problem- Solving Group Drives ...
1 Making the Case for QualityGeneral Motors Technical Problem- Solving Group Drives Excellence The Red X team at General Motors was reduced by 78 percent after the company restructured in 2009. The team turned to lean and the Red X approaches they use to solve vehicle performance issues to increase their output of completed projects by making the Problem- Solving process more efficient. The team s success paved the way for additional projects, which contributed toward a 50 percent reduction in GM s 12-months-in-service warranty. The team earned finalist honors in the 2012 ASQ International Team Excellence Award a Glance ..Before General Motors (GM) entered bankruptcy court protection and underwent significant restructur-ing in 2009, the company employed 150 full-time Red X Masters working in its Technical Problem Solving Group dedicated to vehicle performance investigations. Post-restructuring, there were 32 Red X Masters left and an organization that was ready to get back on its bearings.
2 Instead of allowing less manpower to become a roadblock, the team became determined to increase its output of completed projects and strengthen its role in making every GM vehicle better than the last one. The Red X team embarked on a journey to adapt to GM s new organizational structure, improve its performance, and find a way to show the organization how its efforts directly reach customers. About General MotorsFounded in 1908, GM is an American multinational automotive corporation headquartered in Detroit, MI. In 2011, it was the world s largest automaker by vehicle sales. GM employs 202,000 people and does business in 157 countries. GM has production facilities in 31 countries, and sells and services these vehi-cles through the brands and divisions of Buick, Cadillac, Chevrolet, GMC, Opel, Vauxhall, and 2009, GM undertook operational restructuring to address past failures, improve its overall cost struc-ture, and allow the company to move toward profitability. The new General Motors Co.
3 Emerged in July 2009, and the company returned to profitability in X Problem SolvingRed X strategies are based on the philosophies developed by Dorian Shainin and supported by Shainin, LLC. GM has a 20-year association with the organization and uses Red X as a Technical Problem- Solving tool, primarily after a vehicle is launched, to understand vehicle performance issues. Red X emphasizes that most issues can be corrected by finding the root cause and controlling Megan SchmidtNovember 2012 ASQ Page 1 of 6GM employs 32 Red X Masters dedicated to Solving customer offers Red X certification in four levels: Red X Apprentice, Red X Journeyman, Red X Master, and Red X Teaching Master. Red X Masters possess advanced Technical Problem- Solving skills in manufacturing situations and have demonstrated the ability to develop journeymen. Less than 1 percent of GM per-sonnel have achieved Red X Master certification. Revving Up for ImprovementThe General Motors -Global Manufacturing System (GM-GMS) is rooted in lean methodology and structured around five princi-ples people involvement, built-in quality, standardization, short lead time, and continuous Red X team recognized an opportunity to align the Technical Problem Solving Group s goals with those of the GM-GMS and expand its role within the GM quality organization.
4 To achieve this, the team would need to address a number of impediments, which included: The Red X team was seen as a last-chance, code-red task force. The team was not effectively containing problems and was not driving permanent corrective action through the organization. It also needed to shift its focus from exclusively long-term corrective actions to generating effective short-term solutions based on the latest knowledge to quickly contain issues reported by customers. The Problem- Solving process did not have metrics assigned, and steps the team took to resolve vehicle performance issues were not documented or standardized. Without a formal business plan in place, the goals or objectives of the Group were neither documented nor transparent to the rest of the Problem With the Problem- Solving process Initially, the team was unable to determine where to focus its improvement efforts because process steps were not defined and metrics to track performance did not exist.
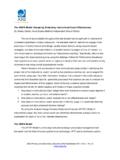
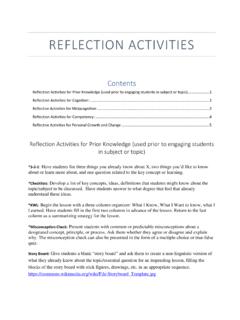
5 Using a value stream map, the team broke the Problem- Solving process down into individual steps. The value stream map, shown in Figure 1, helped them understand inputs, outputs, and identify stakeholders. Red X Problem- Solving steps the team identified are as follows: Queue The staging area for projects needing support from the Red X team. In this step, the problem solver defines the project, prioritizes his/her workload, and orders warranty parts the Green Y An experimental step where the problem solver re-creates the issue the customer experienced. Clue Generation The problem solver utilizes his/her Red X training to converge down to the root cause of the problem. Implementation The problem solver applies corrective actions and completes the project. ASQ Page 2 of 6 QRDsCPITsPDTsIdentify andleveragecontrast.(opportunityto controlvariation)DuplicatetheGreen YCon rmrootcause(Red X)CompleteprojectCompletePRTSC ompletereportDevelopstrategyOrder partsand identifycustomercomplaint.
6 (investigate)Review theworkloadand assignPrioritizeprojectstatusReviewwarra ntydataWarrantypartscenterCImanagerRegio nal/plant master,EGMD ealers, QRD,launch, , BQ, WPCR egional/plant master,EGMCI mgr, QRD,warr engrExecutivedir., globalquality CISMTCPITW arrantydataPEM/VCEQ ueue De ning Assigning Ordering partsDuplicating the Green Y Setting strategy Experiencing customer complaint Clue generation Leveraging contrast Con rming root causeImplementation Correcting the issue Completing the projectFigure 1 Value stream mapASQ Page 3 of 6 Meaningful MetricsValue stream mapping spotlighted areas where improvements were needed, but the team knew an actual measurement system would need to be developed to fully grasp performance. The team discovered an accessible and readily available system known internally as the Problem Resolution Tracking System (PRTS), which is used organization-wide to document all issues during a vehicle s life cycle. The team worked with the PRTS Group to develop a Red X application to begin tracking projects and generate the data needed to complete its performance analysis.
7 Examples of key metrics the team created include: Days in step The average number of days for projects that have completed a Problem- Solving step during the month. It also provides real-time tracking of projects as they move through the system. Step performance trend The average performance trend of projects based on start date. These data show performance improvements over time. Vehicle identification number (VIN) breakpoints A VIN breakpoint represents the first vehicle that is built with the latest knowledge learned from a Red X project. Tracking the number of VIN breakpoints represents the output of the Technical Problem Solving Group , showing the impact of actionable information that has been generated to protect external customers. The Red X application outputted weekly reports and monthly bar charts to show trends in problem resolution time. With actual performance data to analyze, the team determined it should focus its improvement efforts on reducing the time to complete process steps and projects Decision MakingThe team utilized its layered audit system to acquire internal customer feedback to define an acceptable amount of time to solve a problem.
8 The team also examined its Red X application data to observe how long the best of the best (BOB) problem solvers took to complete projects compared to the worst of the worst (WOW). Using the information collected from the Red X application, and knowing that the traditional engineering model of making design changes to correct issues requires an average of 200 days, the team determined that the customer enthusiasm limit to solve a problem is around 60 days. Red X application data showed that the team had been performing outside this parameter, as they were duplicating the Green Y in 70 days on average, and com-pleting their clue generation step in 59 days on meet the customer enthusiasm limit, the team assigned goals for each Problem- Solving step: 25 days for duplicating the Green Y, 25 days for clue generation, and 10 days for implementation. X Marks the ProblemThe team used Red X methodology and tools from the Red X arsenal to find the root cause, or the Red X, bogging down the Problem- Solving process .
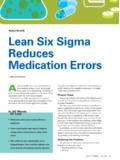
9 One of the major components of Red X methodology is the BOB and WOW contrast, which are Red X terms that indicate opposite tails of a normal and project definition trees, shown in Figure 2, displayed data collected from the measurement system and were used to communicate project information to management in a convergent format. These tools also helped the team prioritize final improve-ment opportunities. The problem definition tree showed that the focus should be the duplicating the Green Y step, as it would have Strategy split: Focus on BOBand WOW on problemresolution time based onstakeholder on duplicating the Green Y based on analysis of data for possible to project contrast projects take < 25 days, WOW projects take > 200 the Red X causing duplicatingthe Green Y times > 25 daysProjectto projectGroup togroupProblemresolutiontimeFirst timequalityDuplicatingthe Green Y55 daysCluegeneration30 daysTechnical problem Solving process improvements Best of the Best(BOB) Projects Worst of the Worst (WOW) Projects050100150200250300350400 Duplicating the Green Y (days)CurrentRequiredFigure 2 Project and problem definition treesASQ Page 4 of 6the largest impact on improving the overall problem resolution time.
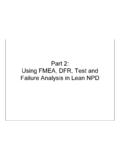
10 A project definition tree showed that the team should use a project-to-project approach to leverage contrast. In an effort to understand why some problem solvers performed better than others, the team used a strategy diagram, depicted in Figure 3, to analyze time in step, step-to-step time, and vari-ance between system management teams. The analysis revealed BOB and WOW projects were alike in every way except for the Green Y difference. The team dug deeper into data and found that BOB projects completed the step in fewer than 25 days, while WOW projects took more than 200 , the team used a Group comparison tool, shown in Figure 4, to compare five BOB and five WOW projects to determine if there was a nonrandom pattern in the data. The team found there was a potential correlation to the engineering investigation process , which is initiated through bulletins as soon as a dealership learns a customer is experiencing a Technical issue. Problem solvers with access to these live cases duplicated the Green Y faster.