Transcription of Lean Six Sigma Reduces Medication Errors - ASQ
1 HEALTHCARE. lean Six Sigma Reduces Medication Errors by Grace Esimai A. mong healthcare Errors , Medication er- using lean Six Sigma to determine what changes in rors, including those made in prescrip- policy and practices might be necessary to signifi- tions, pharmacy dispensing, handling by cantly reduce these Errors . staff and handling by the patient in self-medicating situations, pose the most serious threat. Project Team Interested in quality management in several The group tasked with making this determination areas, management at a mid-sized hospital (which was set up in two tiers: a project team overseen by a chooses to be anonymous) approved a project steering committee. The steering committee consisted of members of upper management and heads of functional depart- ments. This committee appointed employees with In 50 Words relevant daily floor level experience in various asso- Or Less ciated processes as members of the project team.
2 Specifically, these individuals were involved in the Medication Errors pose a serious threat in processes of prescription transcription, order filling healthcare. and all other steps influencing the error rate in the Medication administration records (MARs). A mid-sized hospital used lean Six Sigma to In addition, the project team included individuals who could recommend and implement interven- change policy and practices to reduce these tions to error reduction. The project team periodical- Errors . ly reported to the steering committee. Defining the Problem After solutions were implemented, Errors The process of Medication administration at a dropped sharply, labor costs fell, patients were hospital involves six steps: more satisfied, and employee morale improved. 1. Selecting and procuring. 2. Storing. QUALITY PROGRESS I APRIL 2005 I 51. HEALTHCARE. transcription processes. The project team reviewed and verified the process maps against the current practices and sequence of operations.
3 The team reviewed the Errors observed in February in the pharmacy OE process. An effort was then made to more rigorously define these Errors and establish the criteria for cataloging them to aid in root cause analysis and achieve bet- ter consistency in error tabulation. This attempt minimized subjectivity and thus achieved a more consistent result overall. The project team subse- quently identified the following Errors : Additional instructions: Any physician com- ments/instructions/indications on the original faxed Medication order that are not input by pharmacy. Dose: Wrong dose or dose differs from original faxed Medication order. Drug: Wrong drug ( Medication description differs from original faxed Medication order). Duplicate order entry: Same Medication description profiled twice with two different prescription numbers. Frequency: Frequency on MAR differs from original faxed Medication order. Omissions: Certain Medication is omitted from the OE process without a reason.
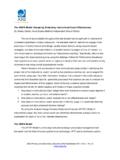
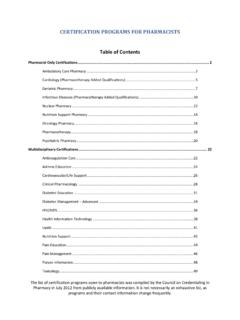
4 Discontinuation order not carried out when received: Medication that is either indicated or implied to be discontinued may still be entered 3. Ordering and transcribing. in the OE by pharmacy. 4. Preparing and dispensing. Order not received: Faxed Medication order is 5. Administering the Medication . not received or cannot be located at the phar- 6. Monitoring Medication effects. macy. Due to time constraints, the steering committee Patient: Medication order has been profiled defined the most urgent problem as the unknown correctly/incorrectly on the wrong patient. error rate in the hospital MAR. The scope of the pro- Route: Medication order has been profiled ject was to concentrate on the Medication order with incorrect route (intravenous or intramus- entry (OE) process. The project team charter aimed cular). to investigate a process to dramatically reduce MAR The Pareto diagram of the data gathered at the Errors by a factor of about 1,000 by the end of the start of the project is shown in Figure 1.
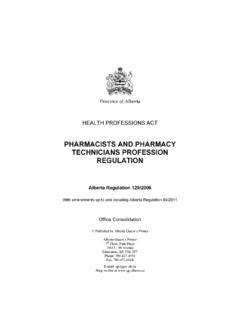
5 The dia- project's five-month duration. gram prioritizes the relative frequency of occur- rence in a bar chart for better visualization. At Measuring the Baseline project initiation, the total error rate in the overall And Tracking Errors MAR process was estimated to be or about Prior to the formation of this project team, the 3,300 per million. hospital's quality improvement department had While reviewing weekly records, the team ob- mapped the pharmacy OE and the nursing MAR served certain Errors could be traced back to the 52 I APRIL 2005 I FIGURE 1 Pharmacy Error Pareto FIGURE 2 February and March Errors Diagram By Pharmacy Employees 60 120 120. Cumulative Errors percentage 50 100 100. Number of Errors Number of Errors 40 80 80. 30 60 60. 20 40 40. 10 20 20. 0 0 0. 1 3 5 7 9 11 13 15 17 19 21. Order not received Frequency Duplicate order entry Dose Omission when received Order not discontinued Additional instructions Drug Other Patient Route Employee codes Series two Series one Series three Types of error as the most objective method, evidence of in- creased Errors became obvious (see Figure 3).
6 Vital Missing Data and Metrics pharmacy employee who committed them. The The basic metric of Six Sigma identifies defects per team quickly tabulated the Errors and discovered a million opportunities, which can also be represented high variability in performance among these em- as a percentage error rate. Error rates are computed ployees. from the ratios of the total number of Errors associat- Some employees committed as many as 112 Errors ed with a population of transactions and the total in the two-month period of February and March, while others made as few as zero Errors in that same period. There were 21. employees involved with the OE process. FIGURE 3 February and March Errors Figure 2 shows the results. Showing Positive Trend To protect their identities, the project Dose line fit plot Omission error line fit plot y-hat = + team coded the employees using a simple y-hat = + 10. number scheme. For immediate interven- 12.
7 10. Omission Dose tion, the team reviewed the Errors during 8 Omission 5 Dose 6. one-on-one meetings with the pharmacy 4 Predicted Predicted 2 omission dose employees and found the high error fre- 0 0. 0 5 10 0 5 10. quencies resulted from a misunderstand- Weeks of Feb. 2 to March 14, 2004 (t) Weeks of Feb. 2 to March 14, 2004. ing of certain guidelines and instructions. To correct this, the pharmacy department Order not received line fit Frequency error line fit plot Plot y-hat = + instituted remedial education and closer y-hat = + t Not 40. Not received supervision of employees. 20 received Frequency The next step was to estimate the trend Frequency 20 Predicted 10. Predicted not of the Errors vs. time. Statistical methods frequency received 0 0. for estimating the trend included moving 0 5 10 0 10. averages, exponential smoothing and Weeks of Feb. 2 to March 14, 2004 Weeks of Feb. 2 to March 14, 2004.
8 Least squares or regression analysis. On Note: y-hat is the value of y estimated from the data as opposed to the actual or observed value. running a regression analysis, our choice QUALITY PROGRESS I APRIL 2005 I 53. HEALTHCARE. number of transactions in the population. Analyzing the Problem To establish a context for identifying the medica- Finally, after all the investigation, the project team tion OE Errors (or MAR Errors ) at the hospital, here found the root causes of all the different types of is an outline of the process sequence: Daily orders Errors to be one or a combination of the following: are faxed to the pharmacy, where they are profiled There were problems with the fax machines on the MAR. Nurses review the MAR and report that used regular telephone lines, and related any error findings to the pharmacy. A pharmacy technical problems caused unnecessary delays, technician then records the Errors by type and who duplicate order entries and nonreceipt of faxed committed them.
9 In this arrangement, it is very dif- orders in the pharmacy. ficult to capture Errors , such as forgetting to fax an Problems with the legibility of physicians'. order, that are committed by the nurses them- handwriting and use of personal nonconven- selves. The pharmacy is thus blamed for every tional abbreviations were partly responsible error, and there is no accountability at the nurses' for wrong doses, drugs and frequencies. Some end for MAR Errors . drug Errors arose from the use of generic vs. trade names. Distractions and interruptions during the order entry process, such as phone calls or questions and conversations with colleagues, Each group believed the other caused omission Errors , the selection of incor- rect drugs or doses from the dictionary, wrong group expected them to do frequency and duplicate order entries. Nonreconciliation among nurses and pharma- the impossible, understanding cists regarding the physician's orders regard- ing the standard way to administer the neither the nature of its work Medication , such as the route, number of times a day and when during the day.
10 Or its workload. Other common cause and human Errors such as not discontinuing orders when received due to oversight, dispensing wrong doses due to becoming used to a certain dose and selecting Medication from nursing station floor stock Another pertinent and vital metric, albeit elu- and forgetting to note a change in dose. sive, is the average order cycle time. This is defined During the investigation, the project team also as the average time it takes the pharmacy to fill an observed the number of human Errors could have order measured from when a physician writes a arisen from stressful and dissatisfactory work con- prescription to when it registers on the MAR as ditions. The team therefore decided each of the two correct. work groups involved should fill out a customer This metric was not available because the phy- satisfaction survey on their perception of needs sicians did not write the time of the prescription.