Transcription of Get In The Zone The basics of Reading Infrared ...
1 Get In The Zone The basics of Reading Infrared Spectrometry Graphs What You Will Learn This is a tutorial to help you learn to recognize and read the peaks in Infrared Spectrometry Graphs. A Bit About Infrared Molecules are vibrating. When they absorb photons of the appropriate energy changes this vibration. What Do We Want to Know? We want to know how the structure is related to the energy that is absorbed. Why Should I care? This will let us make conclusions about the structure. What does an IR spectrum show us? FUNCTIONAL GROUPS!!! are we looking at? X AXIS: stretching frequency Y AXIS: number of photons absorbed More detail about the X and Y axis are explained in detail in Dr. Hardinger s lectures. This tutorial is focused more on how to determine the peaks in the IR What are we looking for? PEAKS! We are looking for downward spikes in the graph.
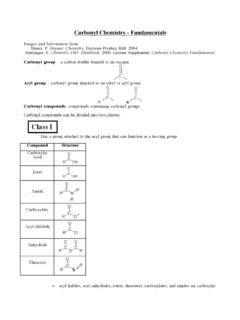
2 Why are some peaks bigger than others? Polarity determines the peak s strength. The more polar a molecule is, the stronger the peak is. Repetition can also determine strength; many of the same functional group leads to a larger peak. How does this help us? This helps us associate peaks with the bonded atoms. Prep Work!!! Calculate the DBE! You will need to look at the DBE value to determine the number of pi bonds. This will help you eliminate and differentiate among functional groups. ZONE 1 This zone takes place between 3700 3200 cm 1 (on the x axis) [ citation (a) ] What are we looking for? Alcohols, terminal alkynes, N H stretches Tips to Note: Peaks may vary in size. Do not immediately rule out peaks because you think they are too small! T h e B r e a k d o w n A l c o h o l s ( O H ) Occur around 3650 3200 cm 1 Alcohols have a very distinct strong and broad shape.
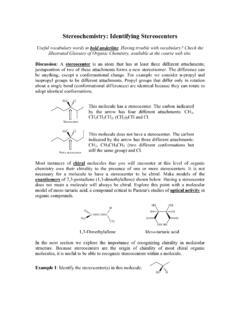
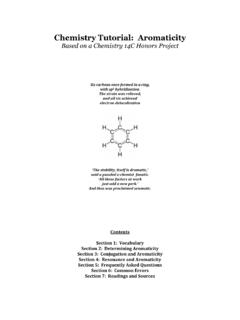
3 When we see this sort of elongated U shape around this region, we know there is an alcohol group. It will generally look like the portion encircled in the pink oval below. [ citation (a) ] T e r m i n a l A l k y n e s ( = C - H ) Occurs around 3340 3250 cm 1 Terminal Alkynes are generally stronger and sharper in shape. The peak within the pink oval below is a terminal alkyne. Be on the lookout for similar shapes in this region. [ citation (b) ] N H s t r e t c h e s Occurs around 3500 3200 cm 1 N H stretches can mean amines or amides, but it does not necessarily have to indicate either of these. These are medium in intensity, but are broader in appearance. NOTE: Be sure to look at your molecular formula to make sure a nitrogen exists in your molecule! A nitrogen is necessary for the existence of an N H stretch!
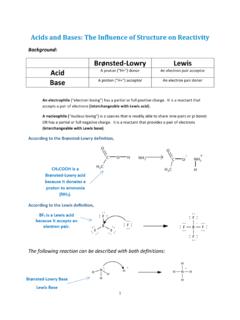
4 All three of the following are N H stretches. The first shows a primary amine, and the second shows a tertiary amine. The last image shows an N H stretch ,which is significantly smaller than in the other examples, but still counts. [ citation (b) ] [ citation (b) ] [ citation (c) ] ZONE 2 This zone takes place between 3200 2700 cm 1 (on the x axis) [ citation (a) ] What are we looking for? Sp2 carbons, sp3 carbons, aldehydes, carboxylic acid Tips to Note: Look for C H bonding in this zone! We are in organic chemistry; nearly every molecule that we deal with will involve C H bonding. Use your writing utensil to map out areas and focus in on these specific areas to make sure you are Reading the graph accurately! T h e B r e a k d o w n S p 2 C a r b o n - H y d r o g e n ( C - H ) Occurs around 3100 3000 cm 1 Sp2 carbons may vary in size and shape It is important to note exactly where you see the peak!
5 This peak will occur in a very small range, highlight it and note it down! [ Professor Steven Hardinger s Thinkbook ] S p 3 C a r b o n - H y d r o g e n / A l k y l ( C - H ) Occurs around 2960 2850 cm 1 Sp3 carbons may also vary in size and shape It is important to note exactly where you see the peak! This peak will occur in a very small range, highlight it and note it down! [ Professor Steven Hardinger s Thinkbook ] A l d e h y d e ( C - H ) One peak around 2900 cm 1 and another around 2700 cm 1 Aldehydes are of medium length and have two peaks. Be careful!! The first peak is often distorted by sp3 carbons and may not bee seen! Look for the second peak around 2700 cm 1. [ Professor Steven Hardinger s Lecture Supplement] The second peak is circled in pink in the image above C a r b o x y l I c A c I d ( O - H ) Occurs around 3000 2500 cm 1 We can determine a carboxylic acid by looking for a strong, broad peak.
6 BE CAREFUL!!! A carboxylic acid has two components, there must also be a C = O in zone 4 to have a carboxylic acid!!! Notice that there is an OH stretch in zone 2 and a C=O stretch in zone 4! [ citation (d) ] Here s another example [ citation (a) ] ZONE 3 This zone takes place between 2300 2000 cm 1 (on the x axis) [ citation (a) ] T h e B r e a k d o w n A l k y n e ( C C ) Around 2260 2000 cm 1 Alkynes have variable and sharp peaks, such as the peak circled in pink below. Note: Look at your DBE value! You need 2 pi bonds to form a triple bond [ citation (e) ] N i t r i l e ( C N ) One around 2260 2220 cm 1 Alkynes have variable and sharp peaks, such as the peak in the pink circle below NOTE: REMEMBER TO USE YOUR MOLECULAR FORMULA!!! If there are no nitrogens present, you will not have a nitrile group!
7 ALSO NOTE: Also, mind the nitrogens in zone 1! DOUBLY ALSO NOTE: LOOK AT YOUR DBE! You need 2 pi bonds to form a nitrile group. [ citation (b) ] ZONE 4 This zone takes place between 1850 1650 cm 1 (on the x axis) This zone contains carbonyls. REMEMBER: Carbonyls are carbons double bonded to Oxygens. PI BONDS ARE NECESSARY! LOOK AT YOUR DBE VALUE! ALSO REMEMBER: Many of these carbonyls relate to other peaks in various other zones of the graph. For some of these functional groups to exist, there must be other corresponding peaks. LOOK FOR THEM! DOUBLY ALSO REMEMBER: All of the peaks in this zone appear strong. Pay attention to the number of photons absorbed (the y axis value)!!! [ citation (a) ] T h e B r e a k d o w n K e t o n e ( C = O ) Around 1750 1705 cm 1 Ketones will have a strong peak. GENERALLY Look for number of photons in the low 1700s.
8 This may not always be the case, however. Remember to look for signs of conjugation! [ citation (d) ] NOTE: 1715 is a common value for a ketone, but can also apply to aldehydes. They fall within similar ranges. How can I tell the difference? If there is an aldehyde, there will also be the double peaked formation in zone 2! Be on the lookout and keep relating what you already know to what you are finding in the following zones! A l d e h y d e ( C = O ) Around 1740 1720 cm 1 Aldehydes will have a strong peak. Look in the low 1700s, but GENERALLY closer to the 1720 range. This may not always be the case, however. Remember to look for signs of conjugation! Notice the aldehyde peak in zone 2 as well! [ Professor Steven Hardinger Lecture Supplement ] E s t e r s ( C = O ) Around 1750 1735 cm 1 Esters will have a strong peak. Numbers around the 1740s range are typical.
9 This may not always be the case, however. Remember to look for signs of conjugation! [ citation (d) ] C a r b o x y l I c A c I d ( C = O ) Around 1250 1700 cm 1 The carbonyl will have a strong peak. Look around 1710s to 1720s. Again, these numbers may vary, this is just a general guideline for what would be considered typical. Notice the O H stretch in zone 2!!! This is necessary for a carboxylic acid! [ citation (d) ] A m I d e ( C = O ) Around 1690 1650 cm 1 The carbonyl stretch will be strong, again. Look for the number of Nitrogens in your molecule. Also, look for the amid group in zone 1! [ citation (b) ] ZONE 5 This zone takes place between 1680 1450 cm 1 (on the x axis) NOTE: This zone includes double bonds! Look at your DBE values!!! T h e B r e a k d o w n A l k e n e ( C = C ) Around 1680 to 1620 cm 1 This peak may vary.
10 It may help to highlight this region to better see the peak. Check your DBE value! [ citation (d) ] B e n z e n e ( C = C ) One peak around 1600 cm 1 and another around 1500 1450 cm 1 This peak may vary. The peak at 1600 may have 2 peaks. Look for both peaks and a DBE value of at least 4! [ Professor Steven Hardinger s Lecture Supplement ] Additional Notes BEWARE OF CONJUGATION!!! We remember that conjugation lowers the energy of a molecule. This implies in Reading IR graphs as well. If functional groups are conjugated, the pi bond can will lower the stretching frequency. More conjugation leads to A lower stretching frequency. You can suspect conjugation when peaks are at the lower end of their range. HIGHLIGHT THE ZONES!!! When getting used to working with the different zones, it may be helpful to color code the zones so you can zero in on specific areas and differentiate peaks that way.