Transcription of Getting Started in Logit and Ordered Logit Regression
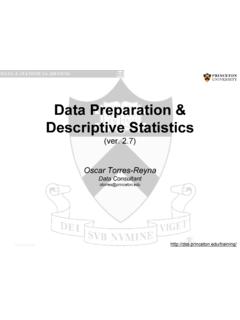
1 PU/DSS/OTRG etting Started in Logit and Ordered Logit Regression (ver. beta)Oscar Torres-ReynaData model Use Logit models whenever your dependent variable is binary (also called dummy) which takes values 0 or 1. Logit Regression is a nonlinear Regression model that forces the output (predicted values) to be either 0 or 1. Logit models estimate the probability of your dependent variable to be 1 (Y=1). This is the probability that some event model +==+==++++==++++++++ )..21()..21(210210210111),..2,1|1Pr(11), ..2,1|1Pr()..21(),..2,1|1Pr(KKKKXXXkXXXk KKkeXXXYeXXXYXXXFXXXY From Stock & Watson, key concept The Logit model is: Logit and probit models are basically the same, the difference is in the distribution: Logit Cumulative standard logistic distribution (F) Probit Cumulative standard normal distribution ( )Both models provide similar results. It tests whether the combined effect, of all the variables in the model, is different from zero. If, for example, < then the model have some relevant explanatory power, which does not mean it is well specified or at all correct.
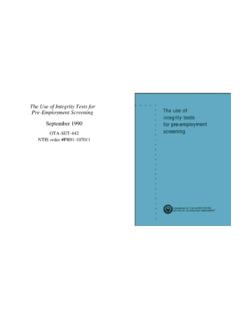
2 PU/DSS/OTRL ogit: predicted probabilitiesAfter running the model: Logit y_bin x1 x2 x3 x4 x5 x6 x7 Typepredict y_bin_hat /*These are the predicted probabilities of Y=1 */Here are the estimations for the first five cases, type:browse y_bin x1 x2 x3 x4 x5 x6 x7 y_bin_hatPredicted ),..,|1Pr() (7217654321= +==+ ++ +XXXXXXXeXXXYTo estimate the probability of Y=1 for the first row, replace the values of X into the Logit Regression equation. For the first case, given the values of X there is 79% probability that Y=1:It tests whether the combined effect, of all the variables in the model, is different from zero. If, for example, < then the model have some relevant explanatory power, which does not mean it is well specified or at all correct. Predicted probabilities and marginal effects For the latest procedure see the following document: The procedure using prvalue in the following pages does not work with Stata 13. PU/DSS/OTR PU/DSS/OTRO rdinal logitWhen a dependent variable has more than two categories and the values of each category have a meaningful sequential order where a value is indeed higher than the previous one, then you can use ordinal Logit .
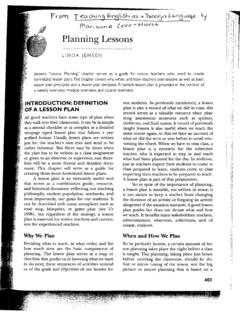
3 Here is an example of the type of variable: Total 490 Agree 196 Neutral 104 Disagree 190 level Freq. Percent Cum. Agreement . tab y_ordinalPU/DSS/OTRO rdinal Logit : the setupNote: 1 observation completely determined. Standard errors questionable. /cut2 .5389237 .1027893 .3374604 .740387 /cut1 .103594 x7 .1782532 x6 .0034756 .0860736 .1721767 x5 .0910174 x4 .2247291 .0913585 .0456697 .4037885 x3.
4 1066394 .0925103 .2879563 x2 .0899153 .1218779 x1 .220828 .0958182 .0330279 .4086282 y_ordinal Coef. Std. Err. z P>|z| [95% Conf. Interval] Log likelihood = Pseudo R2 = Prob > chi2 = LR chi2(7) = logistic Regression Number of obs = 490 Iteration 4: log likelihood = 3: log likelihood = 2: log likelihood = 1: log likelihood = 0: log likelihood = ologit y_ordinal x1 x2 x3 x4 x5 x6 x7 Dependent variableIndependent variable(s)If this number is < then your model is ok. This is a test to see whether all the coefficients in the model are different than p-values test the hypothesis that each coefficient is different from 0.
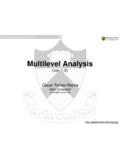
5 To reject this, the p-value has to be lower than (95%, you could choose also an alpha of ), if this is the case then you can say that the variable has a significant influence on your dependent variable (y) Logit coefficients are in log-odds units and cannot be read as regular OLS coefficients. To interpret you need to estimate the predicted probabilities of Y=1 (see next page)Ancillary parameters to define the changes among categories (see next page)Test the hypothesis that each coefficient is different from 0. To reject this, the t-value has to be higher than (for a 95% confidence). If this is the case then you can say that the variable has a significant influence on your dependent variable (y). The higher the z the higher the relevance of the Logit : predicted probabilitiesFollowing Hamilton, 2006, , ologit estimates a score, S, as a linear function of the X s:S = + + + + probabilities are estimated as:P(y_ordinal= disagree ) = P(S + u _cut1) = P(S + u )P(y_ordinal= neutral ) = P(_cut1 < S + u _cut2) = P( < S + u )P(y_ordinal= agree ) = P(_cut2 < S + u ) = P( < S + u)To estimate predicted probabilities type predict right after ologit model.
6 Unlike Logit , this time you need to specify the predictions for all categories in the ordinal variable (y_ordinal), type:predict disagree neutral agreePU/DSS/OTRO rdinal Logit : predicted probabilitiesTo read these probabilities, as an example, typebrowse country disagree neutral agree if year==1999In 1999 there is a 62% probability of agreement in Australia compared to 58% probability in disagreement in Brazil while Denmark seems to be quite probabilities and marginal effects For the latest procedure see the following document: The procedure using prvalue in the following pages does not work with Stata 13. PU/DSS/OTR PU/DSS/OTRP redicted probabilities: using prvaluex= x1 x2 x3 x4 x5 x6 x7 Pr(y=Agree|x): [ , ] Pr(y=Neutral|x): [ , ] Pr(y=Disagree|x): [ , ] 95% Conf. IntervalConfidence intervals by delta methodologit: Predictions for y_ordinal.
7 PrvalueAfter runing ologit (or Logit ) you can use the command prvalue to estimate the probabilities for each event. Prvalue is a user-written command, if you do not have it type findit spost , select spost9_ado from ~jslsoc/stata and click on (click here to install) If you type prvalue without any option you will get the probabilities for each category when all independent values are set to their mean 1 3 0 -1 2 9 4 x1 x2 x3 x4 x5 x6 x7 Pr(y=Agree|x): [ , ] Pr(y=Neutral|x): [ , ] Pr(y=Disagree|x): [ , ] 95% Conf. IntervalConfidence intervals by delta methodologit: Predictions for y_ordinal. prvalue , x(x1=1 x2=3 x3=0 x4=-1 x5=2 x6=2 x6=9 x7=4)You can also estimate probabilities for a particular profile (type help prvalue for more details). For more info go to: probabilities: using prvalueIf you want to estimate the impact on the probability by changing values you can use the options save and dif (type help prvalue for more details) Diff= 1 0 0 0 0 0 0 Saved= 1 2 x1 x2 x3 x4 x5 x6 x7 Pr(y=Agree|x): [ , ] Pr(y=Neutral|x): [ , ] Pr(y=Disagree|x): [ , ] Current Saved Change 95% CI for ChangeConfidence intervals by delta methodologit: Change in Predictions for y_ordinal.
8 Prvalue , x(x1=2) difx= 1 x1 x2 x3 x4 x5 x6 x7 Pr(y=Agree|x): [ , ] Pr(y=Neutral|x): [ , ] Pr(y=Disagree|x): [ , ] 95% Conf. IntervalConfidence intervals by delta methodologit: Predictions for y_ordinal. prvalue , x(x1=1) saveProbabilities when x1=1 and all other independent variables are held at their mean values. Notice the save when x1=2 and all other independent variables are held at their mean values. Notice the dif you can see the impact of x1 when it changes from 1 to 2. For example, the probability of y=Agree goes from 35% to 37% when x1 changes from 1 to 2 (and all other independent variables are held at their constant mean : You can do the same with Logit or probit modelsPU/DSS/OTRU seful links / Recommended books DSS Online Training Section UCLA Resources to learn and use STATA DSS help-sheets for STATA http://dss/online_help/stats_packages/ Introduction to Stata (PDF), Christopher F.)
9 Baum, Boston College, USA. A 67-page description of Stata, its key features and benefits, and other useful information. STATA FAQ website Princeton DSS Libguides Introduction to econometrics / James H. Stock, Mark W. Watson. 2nd ed., Boston: Pearson Addison Wesley, 2007. Data analysis using Regression and multilevel/hierarchical models / Andrew Gelman, Jennifer Hill. Cambridge ; New York : Cambridge University Press, 2007. Econometric analysis / William H. Greene. 6th ed., Upper Saddle River, : Prentice Hall, 2008. Designing Social Inquiry: Scientific Inference in Qualitative Research / Gary King, Robert O. Keohane, Sidney Verba, Princeton University Press, 1994. Unifying Political Methodology: The Likelihood Theory of Statistical Inference / Gary King, Cambridge University Press, 1989 Statistical Analysis: an interdisciplinary introduction to univariate & multivariate methods / Sam Kachigan, New York : Radius Press, c1986 Statistics with Stata (updated for version 9) / Lawrence Hamilton, Thomson Books/Cole, 2006