Transcription of Global Allocation Fund - BlackRock
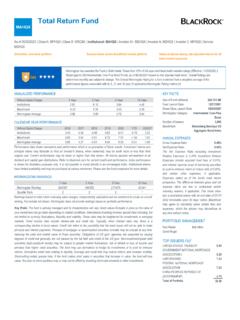
1 Global Allocation fund MDLOX. As of 09/30/2021 | Class K: MKLOX | Class R: MRLOX | Institutional: MALOX | Investor A: MDLOX | Investor C: MCLOX. Unconstrained in search of opportunity A highly experienced and well-resourced investment Seeks returns competitive with Global stocks with team less volatility*. A well-diversified, flexible investment solution that Seasoned portfolio managers combined with a dedicated Over its 30- year history, the fund has delivered returns typically invests across more than 40 countries in 30 investment team seek to generate alpha through macro in excess of Global stocks and bonds with a third less currencies across traditional and non-traditional asset analysis, fundamental research and systematic strategies.
2 Volatility than Global stocks, providing investors a long classes, sectors and capital structures. history of protecting on the downside and rewarding on the upside over a full market cycle. Morningstar has awarded the fund a Bronze medal. Fewer than 10% of US open-end funds hold medalist ratings (Effective 04/06/2021).. Rated against 417 World Allocation Funds, as of 09/30/2021 based on risk adjusted total return. Overall Ratings are determined monthly and subject to change. The Overall Morningstar Rating for a fund is derived from a weighted average of the performance figures associated with its 3-, 5- and 10- year (if applicable) Morningstar Rating metrics.
3 ANNUALIZED PERFORMANCE KEY FACTS. With Sales Charge 1 year 3 year 5 year 10 year Since Inception Size of fund (Millions) $26, Investor A fund Launch Date 02/03/1989. Without Sales Charge 1 year 3 year 5 year 10 year Since Inception Share Class Launch Date 10/21/1994. Investor A Morningstar Category World Allocation Benchmark1 Number of Issuers 123. Morningstar Category Average N/A Benchmark1 36% S&P 500, 24% FTSE World ( ), 24% ICE BofA/ML Cur 5-yr CALENDAR year PERFORMANCE US Treasury, 16% FTSE Non-USD. WGBI. Without Sales Charge 2016 2017 2018 2019 2020 YTD 3Q2021. Investor A ANNUAL EXPENSES. Benchmark1 Gross Expense Ratio Morningstar Category Average Net Expense Ratio Performance data shown represents past performance which is no guarantee of future results.
4 Investment returns and The Net Expense Ratio excluding Investment principal values may fluctuate so that an investor's shares, when redeemed, may be worth more or less than their Related Expenses is Investment Related original cost. Current performance may be lower or higher than that shown. All returns assume reinvestment of all Expenses include acquired fund fees of , dividend and capital gain distributions. Refer to for current month-end performance. Index performance and interest expense (cost of borrowing securities is shown for illustrative purposes only. It is not possible to invest directly in an unmanaged index.)
5 Returns with sales to seek to enhance return or reduce risk) of , charge reflect the deduction of current maximum initial sales charge of The performance information for periods and certain other expenses, if applicable. prior to the inception date of the share class is based on the fund 's Institutional Shares, adjusted to reflect the fees and Expenses stated as of the fund 's most recent expenses applicable to such share class. See the fund prospectus for more details. The calendar year performance prospectus. The difference between gross and net shown does not reflect the deduction of the sales load.
6 If reflected, the performance would have been lower. Please see expense ratios are due to contractual and/or the fund prospectus for more details. voluntary waivers, if applicable. This share class has a contractual waiver with an end date of 06/30/. MORNINGSTAR RANKINGS 2023 terminable upon 90 days' notice. BlackRock 1 year 3 year 5 year 10 year may agree to voluntarily waive certain fees and Morningstar Ranking 294/437 17/400 51/350 98/233 expenses, which the adviser may discontinue at Quartile Rank 3 1 1 2 any time without notice. Rankings based on total return excluding sales charges, independently calculated and not combined to create an overall ranking.
7 For periods not shown, Morningstar does not provide rankings based on synthetic performance. PORTFOLIO MANAGER(S). Rick Rieder (Since 2019). Russ Koesterich, CFA, JD (Since: 2017). David Clayton, CFA, JD (Since: 2017). TOP EQUITY HOLDINGS (%). MICROSOFT CORP ALPHABET INC CLASS C APPLE INC AMAZON COM INC UNITEDHEALTH GROUP INC Total of Portfolio Key Risks: The fund is actively managed and its characteristics will vary. Stock and bond values fluctuate in price so the value of your investment can go down depending on market conditions. International investing involves risks, including risks related to foreign currency, limited liquidity, less government regulation and the possibility of substantial volatility due to adverse political, economic or other developments.
8 These risks may be heightened for investments in emerging markets. Fixed income risks include interest-rate and credit risk. Typically, when interest rates rise, there is a corresponding decline in bond values. Credit risk refers to the possibility that the bond issuer will not be able to make principal and interest payments. Non-investment-grade debt securities (high-yield/junk bonds) may be subject to greater market fluctuations, risk of default or loss of income and principal than higher rated securities. Asset Allocation strategies do not assure profit and do not protect against loss. The fund may use derivatives to hedge its investments or to seek to enhance returns.
9 Derivatives entail risks relating to liquidity, leverage and credit that may reduce returns and increase volatility. Short-selling entails special risks. If the fund makes short sales in securities that increase in value, the fund will lose value. Any loss on short positions may or may not be offset by investing short-sale proceeds in other investments. *Volatility is measured by standard deviation. From first full month post inception (February 28, 1989), annualized standard deviation based on monthly returns is for the fund (Investor A) and for Global stocks (represented by the FTSE World Index).(Source: Morningstar).
10 ASSET Allocation (%)2 REGIONAL Allocation (%)2. fund Benchmark1 Active fund Benchmark1 Active Equity North America Equity Fixed Income Europe Equity Cash Equivalents North America Fixed Income Commodities Cash Equivalents Allocations subject to change. Emerging Market Equity Emerging Market Fixed Income Europe Fixed Income PORTFOLIO CHARACTERISTICS Japan Equity Equity Price/Earnings (FY1) Asia/Pacific (ex Japan) Fixed Income Equity Wtd. Avg. Market Capitalization $330, Asia/Pacific (ex. Japan) Equity Portfolio Effective Duration yrs Japan Fixed Income Assumes 0 duration for equities and commodity-related securities Commodities Fixed Income Effective Duration yrs Fixed Income + Cash Effective Duration yrs CURRENCY Allocation (%)2.