Transcription of Global forest products facts and figures 2018
1 Global forest products facts AND FIGURES2018 INDUSTRIAL ROUNDWOODSAWNWOODWOOD-BASED PANELSFIBRE FURNISHPAPER AND PAPERBOARDWOOD FUEL, CHARCOAL AND PELLETS FAO/FO - 60641 This note presents highlights and recent trends in data for each of the main product groups, as well as a short summary of recent changes or improvements in statistics. Key findings are highlighted below. | Global production and trade of all major wood-based products recorded their highest ever values in 2018. production , imports and exports of roundwood, sawnwood, wood-based panels, wood pulp, wood charcoal and pellets reached their maximum quantities since 1947 when FAO started reporting Global forest product statistics.
2 In 2018, growth in production of the main wood-based product groups ranged from 1 percent (wood-based panels) to 5 percent (industrial roundwood). The fastest growth occurred in the Asia-Pacific, Northern American and European regions, likely due to positive economic growth in these areas. |The year 2018 was not as strong for the paper industry. Global production of paper and paperboard contracted by percent, owing mainly to disruptions in recovered paper supply and continuous replacement of printed media with digital products . |In 2018, Global industrial roundwood removals grew by 5 percent to reach a record level of billion m.
3 Global trade grew 7 percent to a record high of 138 million m , of which 43 percent was imported by China. New Zealand overtook the Russian Federation to become the top exporter of industrial roundwood in 2018. |Wood-based panel and sawnwood production (combined) grew in all five regions around the world in 2018. Global production and trade of both panels and sawnwood increased by 2 percent to a record high of 493 million m and 408 million m respectively. |Canada saw a decline in production and exports of sawnwood from 2016 to 2018 due to trade disputes over import duties imposed by the United States of America, its main market.
4 In contrast, the Russian Federation saw continued growth in sawnwood and panel production and exports, in 2018, surpassing Canada to become the largest sawnwood exporter. | Global production and trade in wood pulp grew by 2 percent to reach record high levels in 2018 (188 million tonnes and 66 million tonnes respectively). Most of the increased supply of wood pulp came from Brazil and Europe. Conversely, Global consumption of recovered paper shrunk by 3 percent to 229 million tonnes, mainly due to declined imports in China. |In 2018, paper production stagnated in Europe and Northern America, while it grew modestly in Latin America and the Caribbean.
5 It declined in Asia-Pacific and Africa. Global production of graphic papers declined by 4 percent while other paper and paperboard recorded a smaller decrease of 1 percent. Among the top five paper producers, only India recorded growth. |China, by far the largest producer and consumer of wood-based panels and paper, has grown in importance as both a producer and consumer of forest products , and has recently overtaken a number of other big players in key product groups ( the United States of America in sawnwood production ). China is also highly significant in international trade of forest products , being the world s largest importer of industrial roundwood, sawnwood and fibre furnish (pulp and recovered paper), and the largest exporter of wood-based panels.
6 In 2018, China s imports of industrial roundwood increased by 8 percent. Sawnwood and panel production and consumption continued to grow faster in China than in the rest of the world. |Wood pellet production has increased dramatically in recent years, mainly owing to demand generated from bioenergy targets set by the European Commission. In 2018, Global production grew by 11 percent, reaching 37 million tonnes, of which more than half (24 million tonnes) was traded internationally. Europe and Northern America accounted for most of the Global production (55 percent and 28 percent respectively); however, the production share of the Asia-Pacific region doubled to 15 percent from 2014 to 2018.
7 |Europe accounted for 75 percent and Asia-Pacific for another 18 percent of Global pellet consumption in 2018. Imports of wood pellets in Asia surged by 51 percent in 2018. Imports of wood pellets increased in Japan and, in 2016, the Republic of Korea became the third largest wood pellet importer, driving up wood pellet production in Viet Nam, Malaysia, Indonesia and Thailand. FAO s forest product statistics present figures for the production and trade (quantity and value) of forest products , covering 59 product categories, 24 product groups, and over 245 countries and territories.
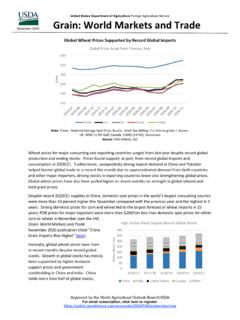
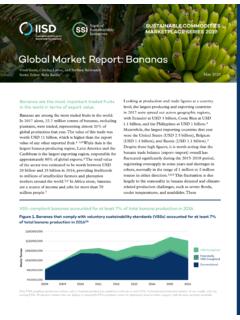
8 Final statistics are released at the end of each year and can be found on-line in the FAOSTAT-Forestry database from December, before they are published in the Yearbook of forest products the following April. The on-line database archives data from 1961, and the yearbooks date back to forest products facts AND FIGURES2018 HIGHLIGHTS FROM 2014 2018 Global forest products / facts AND figures 20182 Global industrial roundwood removals amounted to 2 028 million m in 2018. This is an increase of percent compared to 2017 (1 826 million m ) and percent compared to the level in 2014 (Figure 1a).
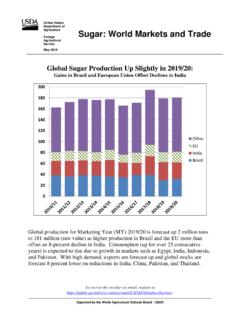
9 In 2018, removals in each region were as follows: Europe (including the Russian Federation) 650 million m (32 percent); Northern America (USA and Canada) and Asia-Pacific each 519 million m (51 percent combined); Latin America and Caribbean 261 million m (13 percent); and Africa 79 million m (4 percent).Removals increased in all regions, with highest growth rate in Latin America and the Caribbean (16 percent from 2014 to 2018) and Europe (13 percent) followed by Asia-Pacific (8 percent) and Africa (7 percent). Removals in Northern America grew by 3 percent over the same 2018, Global trade in industrial roundwood amounted to 138 million m (equal to about 7 percent of production ).
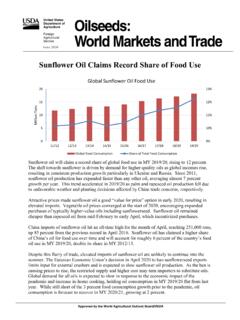
10 Trends in total trade and net trade over the observed period showed a decline of 6 percent in 2015 followed by an increase of 5 percent in 2016, and a 7 percent increase in 2018 (Figure 1b). At a regional level, Asia-Pacific was a net importer of industrial roundwood, and all other regions were net exporters. In 2018, net imports of 41 million m accounted for about 7 percent of consumption in the Asia-Pacific region. Europe and Northern America were the main net exporters of industrial roundwood, with net exports in 2018 of 12 million m and 13 million m the country level, the five largest producers of industrial roundwood are the USA, the Russian Federation, China, Brazil and Canada (Figure 2a).