Example: air traffic controller
Country Analysis Executive Summary: Iraq
Feb 24, 2021 · • Asia (led by India, China, and South Korea) was the main regional destination for Iraq’s crude oil, importing 62% of Iraq’s crude oil exports in 2019 (Figure 2). China and India each imported almost 1 million b/d of crude oil from Iraq (nearly half of Iraq’s total exports), making them the top buyers of Iraq’s crude oil during the year.
Tags:
Information
Domain:
Source:
Link to this page:
Documents from same domain

Monthly Energy Review - Energy Information …
www.eia.govMonthly Energy Review The Monthly Energy Review (MER) is the U.S. Energy Information Administration’s (EIA) primary report of recent and historical energy statistics. Included are statistics on total energy production, consump

Weekly Petroleum Status Report
www.eia.govv Weekly Petroleum Status Report/Energy Information Administration U.S. crude oil refinery inputs averaged 17.2 million barrels per day during the week ending July 13, 2018, which was 413,000 barrels per

Cost and Performance Characteristics of New …
www.eia.govU.S. Energy Information Administration | Cost and Performance Characteristics of New Generating Technologies, Annual Energy Outlook 2018 1

2016 Average Monthly Bill- Residential
www.eia.gov2016 Average Monthly Bill- Residential (Data from forms EIA-861- schedules 4A-D, EIA-861S and EIA-861U) State Number of Customers Average Monthly

Oil market outlook and drivers - U.S. Energy …
www.eia.govWorld supply and demand million barrels per day implied stock change million barrels per day NAS | Oil market outlook and drivers, May 4, 2016 Global supply has consistently exceeded demand since the start of 2014;

Natural Gas Monthly - Energy Information …
www.eia.govJune 2018 ii U.S. Energy Information Administration | Natural Gas Monthly This report was prepared by the U.S. Energy Information Administration (EIA), the …

Year-over-year summary July 2018
www.eia.govU. S. Energy Information Administration | Drilling Productivity Report 0 1,000 2,000 3,000 4,000 5,000 Anadarko Appalachia Bakken Eagle Ford Haynesville Niobrara Permian

U.S. Energy Information Administration
www.eia.govIndependent Statistics & Analysis Drilling Productivity Report July 2018 For key tight oil and shale gas regions U.S. Energy Information Administration

STEO Current/Previous Forecast Comparisons: U.S. …
www.eia.govCurrent Forecast: July 10, 2018; Previous Forecast: June 12, 2018 Q1 Q2 Q3 Q4 Q1 Q2 Q3 Q4 Q1 Q2 Q3 Q4 2016 2017 2018 2019 2016-2017 2017-2018 2018-2019

PADD 5 Transportation Fuels Markets - U.S. Energy ...
www.eia.govU.S. Energy Information Administration | PADD 5 Transportation Fuels Markets i . This report was prepared by the U.S. Energy Information Administration (EIA), the …
Related documents

Steel Exports Report: China
legacy.trade.govApparent Consumption: Domestic crude steel production plus steel imports minus steel exports. Shipment data are not available for all countries, therefore crude steel production is used as a proxy. Export Market: Destination of a country’s exports. Flat Products: Produced by rolling semi-finished steel through varying sets of rolls.
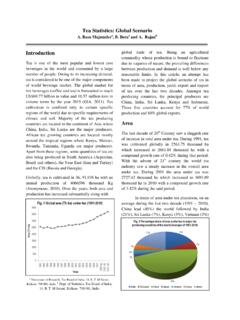
Tea Statistics: Global Scenario - Tea Board of India
teaboard.gov.intotal world exports averages 41% of total world production and 84% of exports accounted for by six countries (India, Sri Lanka, China, Kenya, Indonesia and Vietnam). The largest tea producers India and China drink away most of their own production and share only a small fraction of exportable tea. Sri Lanka and
Burma Rice Exports Disrupted Amid Coup
apps.fas.usda.govconsumption and USDA now reflecting Sri Lankan customs data1 United States Imports 3,300 3,100 -200 Slow import pace of Durum and Hard Red Spring Argentina Exports 11,000 10,500 -500 Shipments remain significantly behind seasonal pace European Union Exports 27,000 27,500 500 Larger recent shipments India Exports 2,500 2,700 200
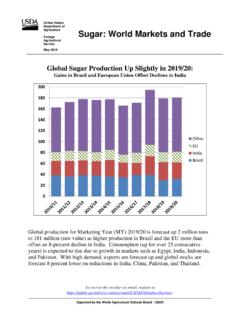
Sugar Production and Trade Rebound in Mexico
apps.fas.usda.govconsumption and food services. Exports are forecast to more than double due to the recovery in production while stocks are expected to be down from the 2020/21 record on higher exports. Pakistan production is forecast up 11 percent to 6.7 million tons due to higher area and yields.
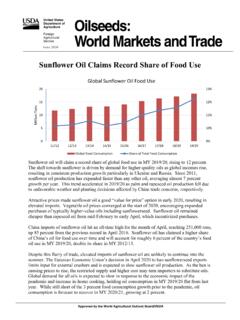
India Implements Further Cuts to Palm Oil Duties
apps.fas.usda.govGlobal production of protein meal is forecast higher with the larger crush expected. Protein meal trade is up primarily on higher India soybean meal exports and Canada’s focus on producing and exporting rapeseed products instead of seed. Protein …
Food Processing Industry in India: Challenges and Potential*
rbidocs.rbi.org.inMar 11, 2020 · exports and strengthen the domestic supply chain. India, with about 11.2 per cent of total arable land in the world, is ranked first in the production of milk, pulses and jute, second in fruits and vegetables and third in cereals (Government of India, 2019). It is also the sixth largest food and grocery market in the world (Law, et al., 2019).
Global forest products facts and figures 2018
www.fao.orgconsumption of recovered paper shrunk by 3 percent to 229 million tonnes, mainly due to declined imports in China. | In 2018, paper production stagnated in Europe and Northern America, while it grew modestly in Latin America and the Caribbean. It declined in Asia-Pacific and Africa. Global production of graphic papers declined by 4 percent while
TRADE BETWEEN DEVELOPED AND DEVELOPING …
www.oecd.orgimports from the developing countries in the apparent consumption of manufactured goods (production plus imports minus exports) in the developed countries. This ratio increased from 0.9 per cent in 1973 to 1.5 per cent in 1 , and again to 2.0 per 9

MSME and BuSinESS EntrEprEnEurShip
ncert.nic.inproducts, from simple consumer . goods to high-precision, sophisticated finished products. Recognising the potential of this . sector for the national development, this segment of industry is encouraged in both in pre-reform and post–reform period for fulfilling the objective of self-reliance and rural industrialisation. In India, the MSME ...
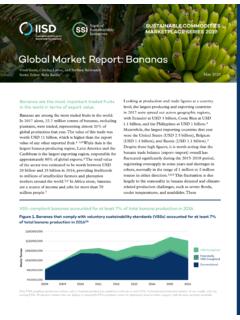
Global Market Report: Bananas
www.iisd.orgcompliant, while conventional banana production accounted for 92% of the market. Looking at future projections, the market advisory firm Mordor Intelligence predicts that the sector will experience a compound annual growth rate (CAGR) of 1.21% in consumption from 2019 to 2024, reaching a global consumption volume of 136 million tonnes by