Example: bachelor of science
Haynesville Region April 2022 Drilling Productivity Report
Rig count rigs drilling data through March projected production through May April 2022 Drilling Productivity Report Monthly additions from one average rig May April barrels/day month over month Oil 0 Gas thousand cubic feet/day month over month -211 Haynesville Region million cubic feet/day month over month
Tags:
Information
Domain:
Source:
Link to this page:
Documents from same domain

U.S. Energy Information Administration
www.eia.govIndependent Statistics & Analysis Drilling Productivity Report July 2018 For key tight oil and shale gas regions U.S. Energy Information Administration

Year-over-year summary July 2018
www.eia.govU. S. Energy Information Administration | Drilling Productivity Report 0 1,000 2,000 3,000 4,000 5,000 Anadarko Appalachia Bakken Eagle Ford Haynesville Niobrara Permian

Weekly Petroleum Status Report
www.eia.govv Weekly Petroleum Status Report/Energy Information Administration U.S. crude oil refinery inputs averaged 17.2 million barrels per day during the week ending July 13, 2018, which was 413,000 barrels per

Cost and Performance Characteristics of New …
www.eia.govU.S. Energy Information Administration | Cost and Performance Characteristics of New Generating Technologies, Annual Energy Outlook 2018 1

2016 Average Monthly Bill- Residential
www.eia.gov2016 Average Monthly Bill- Residential (Data from forms EIA-861- schedules 4A-D, EIA-861S and EIA-861U) State Number of Customers Average Monthly

Oil market outlook and drivers - U.S. Energy …
www.eia.govWorld supply and demand million barrels per day implied stock change million barrels per day NAS | Oil market outlook and drivers, May 4, 2016 Global supply has consistently exceeded demand since the start of 2014;

Natural Gas Monthly - Energy Information …
www.eia.govJune 2018 ii U.S. Energy Information Administration | Natural Gas Monthly This report was prepared by the U.S. Energy Information Administration (EIA), the …

Monthly Energy Review - Energy Information …
www.eia.govMonthly Energy Review The Monthly Energy Review (MER) is the U.S. Energy Information Administration’s (EIA) primary report of recent and historical energy statistics. Included are statistics on total energy production, consump

STEO Current/Previous Forecast Comparisons: U.S. …
www.eia.govCurrent Forecast: July 10, 2018; Previous Forecast: June 12, 2018 Q1 Q2 Q3 Q4 Q1 Q2 Q3 Q4 Q1 Q2 Q3 Q4 2016 2017 2018 2019 2016-2017 2017-2018 2018-2019

PADD 5 Transportation Fuels Markets - U.S. Energy ...
www.eia.govU.S. Energy Information Administration | PADD 5 Transportation Fuels Markets i . This report was prepared by the U.S. Energy Information Administration (EIA), the …
Related documents
White Paper Digital Transformation Initiative Oil and Gas ...
reports.weforum.orgSep 21, 2016 · A single drilling rig at an oilfield, for example, can generate terabytes of data every day, but only a small fraction of it is used for decision-making. As other capital-intensive industries (such as aviation and automotive) have revolutionized their business and operating models through

Geology
usscouts.orgoperating drilling rig. While there, talk with a geologist and ask to see what the geologist does onsite. Ask to see cutting samples taken at the site. c. Mineral Resources Option 1. Define rock. Discuss the three classes of rocks including their origin and characteristics. 2. Define mineral.
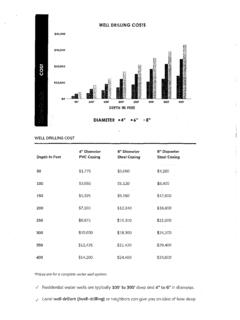
WELL DRILLING COSTS - California
cvfpb.ca.govNov 08, 2020 · drilling location with a drill rig as a source of heating and cooling energy for a home. During colder months, the solution brings the heat back to the house; in the summer, heat is taken from the house and transferred to the ground. Artesian Well Cost . An artesian well costs $35 . to . $85 . per foot or . $5,000 . to . $15,000 for drilling and
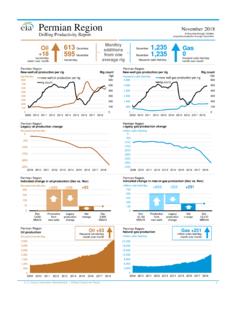
Permian Region April 2022 Drilling Productivity Report
www.eia.govnew-well oil production per rig rig count New-well oil production per rig barrels/day Permian Region Rig count rigs (1,200) (800) (400) 0 400 800 ... Rig count rigs drilling data through March projected production through May April 2022 Drilling Productivity Report Monthly additions from one average rig May barrels/day
STANDARD FORMAT EQUIPMENT LIST LAND DRILLING …
www.iadc.orgdrilling project. the international association of drilling contractors (including chapters) disclaim any liability whatsoever for loss or damages that may result from use of the form or portions or variations thereof. instructions: the standard format equipment list has been developed to provide a